| Issue |
Knowl. Manag. Aquat. Ecosyst.
Number 423, 2022
Ecosystem services and economics
|
|
|---|---|---|
| Article Number | 12 | |
| Number of page(s) | 14 | |
| DOI | https://doi.org/10.1051/kmae/2022010 | |
| Published online | 02 June 2022 | |
Research Paper
Economic valuation of wetland ecosystem services in northeastern part of Vietnam
1
Faculty of Geography, VNU University of Science, 334 Nguyen Trai, Thanh Xuan, Hanoi, Vietnam
2
Center for Technology in Water and Wastewater, School of Civil and Environmental Engineering, University of Technology Sydney, Sydney, NSW 2007, Australia
3
Geography Institute, Vietnam Academy of Science and Technology (VAST), 18 Hoang Quoc Viet, Cay Giay, Ha Noi, Vietnam
* Corresponding author: This email address is being protected from spambots. You need JavaScript enabled to view it.
Received:
13
July
2021
Accepted:
20
March
2022
Abstract
Coastal wetlands have been heavily exploited in the world. Valuation of ecosystem services help to provide the necessary improvements in coastal policy and management to monitor the driving forces of ecological changes in wetland ecosystems. In this study, the monetary values of wetland ecosystem services (WES) in the northeastern part of Vietnam were evaluated based on the integration of different quantitative methods, including interview, remote sensing, ecological modeling, statistic, and cost-benefit analyses. Particularly, seven wetland ecosystems and eleven services obtained from them were identified. As a result, the annual net WES value is evaluated at more than 390 million USD. The intensive and industrial aquaculture ecosystems in the northeastern part represent the highest economic value with more than 2100 USD/ha/year. A “planning” scenario was formulated to predict WES for the next ten years based on policy changes published by local managers. The framework developed here can serve as a decision support tool for environmental and economic managers in wetlands planning.
Key words: Ecosystem service value / cost benefit analysis / wetland ecosystem
© K.B. Dang et al., Published by EDP Sciences 2022
 This is an Open Access article distributed under the terms of the Creative Commons Attribution License CC-BY-ND (https://creativecommons.org/licenses/by-nd/4.0/), which permits unrestricted use, distribution, and reproduction in any medium, provided the original work is properly cited. If you remix, transform, or build upon the material, you may not distribute the modified material.
1 Introduction
The economic value of wetland ecosystem services (WES) per hectare has been ranked first among all kinds of natural ecosystems (CBD, 2015; Meng and Dong, 2019). The value of WES is expected to be 47 percent of the total value of the global ecosystem (Xu et al., 2020). However, according to the Ramsar Convention Secretariat, the area of global wetlands has reduced by about 35% between 1970 and 2015 due to sea level rise, extreme storms, and human activities, including 35% of mangroves, 29% of seagrass beds, and 30% of coral reefs (Barbier et al., 2008; Waycott et al., 2009). This led to a significant reduction in the overall value of WES. For example, the decrease marsh WES value by 9.9 trillion dollars per year from 1997 to 2011 according to recent research is equivalent to 1.4 times of China’s Gross Domestic Product in 2011 (Costanza et al., 2014; Kubiszewski et al., 2016). Therefore, it is undeniable that the destruction of wetlands will result in massive economic losses. However, current knowledge of the trends and processes underlying human impacts on coastal WES values is poor, especially in emerging regions where wetland changes are escalating due to rapid urbanization and industrialization (Gao et al., 2014; He and Sikor, 2015).
Wetlands play an important role in regulating the global environment, preserving the global hydrological cycle, sustaining habitat diversity, and ensuring human well-being (Chen et al., 2009a; Liquete et al., 2016; Sun et al., 2018; Xu et al., 2020). Wetland ecosystems can provide humans with not only direct economic resources such as seafood, recreation and tourism, but also indirect values such as climate and natural hazard regulation (Burkhard et al., 2014; Dang et al., 2019). Since the majority of the values rendered by wetland environments are not exchanged in the economic market, the importance of wetland habitats is still overlooked or ignored by owners, government, and the general public (Friess, 2016; Vieira da Silva et al., 2014). Therefore, the valuation of WES is useful for coastal managers to track the driving forces of ecological change, and then to choose appropriate coastal policy and management for local wetland ecosystems.
The northeastern coast of Vietnam has become a dynamic and sustainable economic zone during the last decade (Thi Kim Chi et al., 2017; Tue et al., 2018). The gross regional domestic product (GRDP) rate increased 10.05% from 2019 to 2020 although the national economy was strongly affected by the COVID-19 crisis according to Vietnamese General Statistics Office1. To do so, local managers have encouraged green economy to obtain sustainable benefits1 from coastal ecosystems. Particularly, local fishing production has increased from 86,000 tons to more than 130,000 tons since 2019 (Thi Kim Chi et al., 2017). More than 4,000 tons of rubbish collected on the sea since 2015 have made the local coastal environment cleaner (Naganuma, 2014). The area of mangrove forests has strongly fluctuated from 17,000 ha to 23,000 ha during the period 2000–2020 (Thao et al., 2013), and famous landscapes in the world, such as Ha Long Bay or Bai Tu Long Bay, attracted 14 million tourists in the year 2019 (Mai and Smith, 2018; Tseng et al., 2011, 2018). The rapid economic growth and land use/cover changes require a clear valuation of the use and non-use values of wetland ecosystem services to avoid negative impacts on environment (Tajima et al., 2019; Thai et al., 2017). The valuation of WES is an important step to balance the benefits obtained from wetland ecosystems and to propose suitable Wetlands of International Importance (RAMSAR) and world natural heritage sites.
The main aim of this study is to estimate the Ecosystem Service Value (ESV) of wetlands in the northeastern coast of Vietnam, particularly from the Mong Cai city (Quang Ninh province) to the Van Uc estuary (Hai Phong province). Instead of using an economic approach, only focusing on the interests from ecosystem stocks, the ecosystem service approach was proposed to analyze in deep the spatial and temporal relations between the multi-services provided by wetlands (Moore and Hunt, 2012; Zorrilla-Miras et al., 2014; Baveye et al., 2016; Merriman et al., 2016). The ecosystem service approach to estimate WES values is a potentially interesting option for environment valuation.
The primary goal of this study is to explore three research questions:
Is it feasible to estimate the value that wetland ecosystems provide to human in the northeastern part of Vietnam?
What is the worth (value) of wetland ecosystems in the northeastern part of Vietnam?
How the economic values of wetland ecosystem services in the northeastern part of Vietnam have changed over the past 20 years and how they may change in the future?
2 Material and methods
Various methods were used in this study including interview, remote sensing, statistic and cost benefit analysis for valuating WES. In addition to the use of the Integrated Valuation of Ecosystem Services and Tradeoffs (InVEST) model as a powerful tool for ecological analysis (Redhead et al., 2016), a machine-learning model for land-cover classification was developed to assess change of wetland area in the research area (i.e. the ResU-Net; Dang et al., 2020).
2.1 Case study
The spatial scope of the study area includes the coastal wetlands of Hai Phong and Quang Ninh ( Fig. 1). Based on the boundary defined by administrative management unit (Naganuma, 2014), we separated the research area into seven wetland regions from north to south: Mong Cai-Dam Ha region, Tien Yen estuary, Van Don district, Cua Luc bay, Cam Pha district, Quang Yen district, and Van Uc estuary (Dang et al., 2020; Thao et al., 2013).
The wetland strip in the northeastern Vietnam is an ecosystem with a high diversity of landscapes and flora and fauna, with e.g. 400 species of fishes, 160 species of coral, and 140 species of sea algae (Thi Kim Chi et al., 2017). Quang Ninh province has more than 40,000 ha of tidal flats, 20,000 ha of bays and more than 100,000 ha of shallow coastal lagoons in Ha Long Bay and Bai Tu Long Bay (Lan, 2009; Thuy et al., 2019). The area enjoys a very favorable environment for developing shrimp, fish and seafood farming for export. The application of advanced technologies in aquaculture, marine and coastal aquaculture has turned fisheries into a strong economic sector.
According to photo-interpretation provided by the Vietnam Academy of Science and Technology, the entire studied area covers nearly 378,000 hectares, agricultural land area representing 54,000 ha (14.3%) (Fig. 1). The area of wet rice cultivation covers more than 33,000 ha, making up 61.4% of the agricultural land. Wet rice land is mainly concentrated in the districts of Quang Yen, Mong Cai, Tien Yen, Uong Bi and Ha Long city (Tong et al., 2020). Mangroves are mainly concentrated in the Quang Ninh province with 14,400 ha covered, the Hai Phong province owning only 3500 ha near the mouth of the Van Uc River and Cat Ba Island (Bui et al., 2014).
According to provinces statistics (Naganuma, 2014), the area of abandoned shrimp ponds in the studied region is about 15,000 ha, of which, 9,100 ha belong to Quang Ninh and 5900 ha belong to Hai Phong. Meanwhile, the lagoon area being used for aquaculture/seafood is nearly 21,000 hectares, accounting for 38.6% of the agricultural land. The services provided by wetlands are also reflected in the potential for aquaculture, with 13,000 ha of ponds, lakes, and low-lying fields that can be developed for intensive farming. Areas with great potential for aquaculture are Quang Yen town (7500 ha), Mong Cai-Dam Ha coastal strip (5500 ha), Van Don district (3300 ha), Van Ucestuary (2000 ha), and Tien Yen district (1400 ha) (Dang et al., 2020).
The sea dyke system in the northeastern coast of Vietnam has a length of 22.85 km, with 9.7 km (42.35%) of sea dyke with mangrove protected forests and 13.15 km of sea dyke (57, 55%) without mangroves protection (Le, 2015). The planting of mangrove forests to protect the sea dykes in the study area is currently being implemented by many national and international organizations. Mangrove systems not only minimize marine disasters but also play an important role in accumulating soil carbon and creating annual coastal livelihoods.
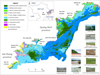 |
Fig. 1. Wetland ecosystems in the northeastern part of Vietnam (adapted from (Dang et al., 2020)). |
2.2 Identification of wetland ecosystems
As mentioned in the Government's Decree No. 66/2019/ND-CP in 2019, Decision No. 1093/QD-TCMT of the Vietnam Environment Administration, and the Ramsar Convention, wetlands are defined as “peatlands, permanent or temporary inundated areas, including coastal areas and islands, with a depth of no more than 6 meters at the lowest tide” (Ramsar Convention Secretariat, 2016). According to the above definition, wetlands are defined as the ecological transition zone between the terrestrial environment and the submerged environment where the typical flora and fauna can develop (Maynard et al., 2015; RAMSAR, 2010).
Based on the MONRE classification system and the RAMSAR convention ( Tab. 1), the coastal wetland ecosystems are classified into 19 types, including 12 types of natural wetlands and seven types of human activities. Irrigated land and seasonally inundated agricultural land were grouped into one category (Hoang and Le, 2006). In this study, we only focused on 10/19 types of natural wetlands as the remaining nine types are mainly found in the southern regions and island systems. In addition, objects with narrow width, difficult to identify on remote sensing images, such as canals, drainage canals, small ditches were also discarded.
The daily tidal water level in the study area ranges from three to four meters, and the shoreline in the topographic map of Vietnam is determined at the mean tidal range. Therefore, the contour line of the highest boundary wetland areas will be two meters long. In topographic maps, the lowest value of the inland contour before reaching the coastline is 2.5 m. The distance from these contour lines to the coastline is less than 10 m. Therefore, we chose the isometric line 2.5 m deep as the deepest boundary of the wetlands. In addition, the offshore boundary is limited to “6” meters below sea level according to the wetland classification system of RAMSAR and MONRE.
We developed a deep learning tool named the ResU-Net model for wetland classification in the research area. The model was built based on the integration of two deep learning networks called Restnet and U-Net (Dang et al., 2020). The ResU-Net model uses Sentinel-2, ALOS-DEM and NOAA-DEM remote sensing images as input data to identify the location of nine coastal wetland ecosystems in 19 types of the RAMSAR and MONRE classification systems. After training and testing processes, the accuracy of the outcomes reaches more than 90% (Dang et al., 2020), especially for forested intertidal wetlands, aquaculture ponds and farms. Once optimized, the ResU-Net model was also used to accurately map coastal wetlands in the Northeast of Vietnam. Results are presented in Figure 1.
Wetlands classification system for the Northeastern part of Vietnam , based on RAMSAR, MONRE, modified from (Dang et al., 2020; Guo et al., 2017; Hoang and Le, 2006).
2.3 Monetary valuation of wetland ecosystem services
In addition to the use of the ResU-Net model for wetland ecosystems classification, different methods were applied to monetarize WES, including: interview, remote sensing, ecological modeling (InVEST), and cost benefit analyses. According to Champ et al. (2003), Turpie et al. (2010) and Vo et al. (2012), the WES valuation was processed in three steps which include identifying economic value types (Step 1), valuating each WES (Step 2) and valuating total WES (Step 3) in the research area.
2.3.1 Identification of economic value types of ecosystem services
The process of identifying the different types of economic values obtained from the ecosystems (e.g. Almeida et al., 2018; Haines-Young, 2011; Pennington et al., 2017; Zhou et al., 2020) is developed in Figure 2. We also took into account consultation of experts, local officials and people. These consulted persons included 23 ecologists and scientists in geography and environmental economics, and 16 local officials directly interviewed from the Agriculture, Urban Planning and Cadastral Departments of the District People's Committees. The scientists and local officials played an important role in assessing and validating all questions, criteria and procedures established before initiating the interview process. The interview process was done in a face-to-face form with 15 main questions related to different kinds of local livelihoods in wetland ecosystems ( Tab. 2). Each question includes a few sub-questions related to income and expense of local people from direct and indirect benefits obtained from the wetland ecosystems. Lastly, four important groups of economic values were classified in the study area (Fig. 2). These groups correspond to direct and indirect use values, option values and non-use values. Indirect use value and existence values were directly collected from regulators; while most of the direct, option and bequest values were collected from local people.
The surveys and interviews in this study were conducted after the second outbreak of Covid-19 in Vietnam, so the research team encountered some difficulties related to people's reluctance to interact with strangers. In addition, the people in some places such as Tien Yen and Dam Ha are not well educated, so that many of them did not fully understand the content of the questions. In order to minimize falsity in collecting information, the interviewers were accompanied by local officials during the interviews for help in explaining the questions asked to people.
The interview process was conducted in seven regions of the northeastern part of Vietnam. 672 households with wetland and tourism-based livelihoods were interviewed directly. In addition to the detailed information on economic values mentioned above, the households were also asked to confirm or supplement other benefits obtained from the local wetland ecosystems. To cover all local likelihood features in the wetland, the interview process received helps from local officials to select typical households. Accordingly, all interviewees provided all information about their income and expense from their production. This information was pre-processed and used to calculate all WES values. The values of each WES were chosen based on median values of interviewed data after transforming all data to normal distribution.
The list of 15 main questions related to different kinds of local livelihoods in wetland ecosystems.
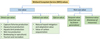 |
Fig. 2. Groups of economic values for wetland ecosystems in the northeastern coastal area of Vietnam. |
2.3.2 Direct Use Values (DUV)
In this study, the use value is the value that individuals receive from natural resources of wetland ecosystems, directly or indirectly. Use values included: direct, indirect and option values (Chen et al., 2009a; Sannigrahi et al., 2019). Accordingly, the direct use values from wetland ecosystems were obtained from six main sources including (1) wild fishing captures, (2) aquaculture production, (3) aquatic bird production, (4) wet rice production, (5) beekeeping (or apiculture), and (6) tourism and recreation. Different equations to evaluate six WES types are presented in detail below based on guidelines from Defra (2007), Newton et al. (2012), and Pascual et al. (2010). The process of data collection and calculation of economic values from these types of services are discussed in this section.
2.3.2.1 DUV1 – wild fishing value
Fishing is mainly done in estuarine, intertidal and mangrove areas. The aquatic species there include: (1) Molluscs such as scallops, cockles, snails, mussels and cephalopods; (2) Crustaceans such as shrimps and crabs; (3) fishes such as gobies; and (4) other types of seafood such as earthworms (Yee et al., 2014). To calculate the ability of wetland ecosystems to provide natural seafood resources throughout the area, the following formula was applied:
 (1)
(1)
where i is the ordinal number of the caught species; H is the total number of fishermen; ni is the percentage of the exploiters of the species i (%); qi is the catch volume of species i per person in the season (kg/person/year); pi is the catch volume of species i per off-season person (kg/person/year); mi is the cost of 1 kg of species in the season (million VND); ki is the cost of 1 kg of species in the off-season (million VND); Ci is the cost of fishing gear in 1 year (million VND).
2.3.2.2 DUV2 – aquaculture value
Regarding aquaculture, local people focus on farming in ponds, tidal flats, estuaries and mangroves. Currently, there are two popular farming methods: extensive farming and industrial farming, in which shrimps, sea crabs, fishes and mollusks are commonly farmed (Bayne, 2017; Froehlich et al., 2017; van Oudenhoven et al., 2015). To calculate the ability of wetland ecosystems to provide marine resources through farming, the following formula was applied:
 (2)
(2)
where i is the ordinal number of farmed species; S is the aquaculture area (ha); ni is the percentage area used for species i (%); NSi is the yield of species i in 1 ha/year (kg/ha); Pi is the market price of 1 kg of species i (million VND); Ci is the aquaculture investment cost of species i in 1 year (million VND).
2.3.2.3 DUV3 – aquatic poultry value
People in the northeastern coast of Vietnam take advantage of mollusks, plankton, shrimps, juveniles of fishes living in mangrove ecosystems, tidal flats and estuaries for waterfowl farming. The estimation of the economic value was calculated by the following formula:
 (3)
(3)
where i is the ordinal number of farmed aquatic birds; T is the total number of aquatic birds in the whole area; ni is percentage of i aquatic bird type (%); Wi is the meat weight of i aquatic-bird type (kg); Pi is the market price of 1 kg of i aquatic-bird meat (million VND); Ci is investment cost of i aquatic bird farming in one year (million VND).
2.3.2.4 DUV4 – value of agricultural cultivation in wetlands
The northeast coastal region enjoys great values from wet rice cultivation (Naganuma, 2014). The following formula was used to calculate the value of agricultural production in wetlands:
 (4)
(4)
where S is the total area of wet rice cultivation in 1 year (ha); NS is the yield of rice obtained per 1 ha in 1 year (quintal); P is the market price of 1 quintal of rice (million VND); C is the investment cost of rice cultivation of 1 ha per year (million VND).
2.3.2.5 DUV5 – beekeeping value
The expansion and protection of the mangrove system not only helps in regulating the air quality and storing carbon, but also helps people taking advantage of the flowering season to develop beekeeping and collecting honey (Davis et al., 2017; Hardman et al., 2016). When mangrove apples and large-leafed orange mangrove bloom in the summer, bees can enjoy a favorable condition to grow. On average, each year, a flock of bees can bring households 15–20 liters of natural honey. With an average price of 4.5 USD/liter, the income from selling honey is about 4500–7000 USD/year. In addition, households receive income from selling bees for about 45 USD/flock. Taking the advantage of the available coastal mangroves, beekeepers do not have to incur the expense of planting flowering trees to feed the bees. The value of beekeeping in mangrove forest is calculated by the following formula:
 (5)
(5)
where T is the total number of swarms of bees in the whole area in a year; SL is the honey production of a swarm of bees per year (liter); P is the market price of 1 liter of honey (million VND); C is the investment cost of beekeeping for a flock per year (million VND).
2.3.2.6 DUV6 – tourism and recreation values
In cultural ecosystem services, tourism and recreation values have become the largest sector in the world (Kubalíková, 2020; Nahuelhual et al., 2013). For example, tourism and recreation have provided more than 280 million jobs and produced nearly 10% of the global gross domestic product in 2015 (Pröbstl-Haider, 2015).
In the study area, the calculation of cultural services and natural entertainment values was based on visiting fees and the revenue of the local ecotourism industry. Potential costs of tourists, citizens and other stakeholders in this sector include: ticket fee for tourist attractions, environmental protection fee, fee for marine waste collection, and other service fees. Total tourism value was collected from the economic departments of coastal communes and districts in 2019; the aim was to avoid irrelevant information from the COVID-19 crisis in 2020 during the assessment process.
The InVEST tool is an application to quantify the value of ecosystem services including sub-models (Posner et al., 2016). In order to quantify the tourism and recreation values in particular sub-regions, the authors integrated the “recreation and tourism” and “Scenic quality” models in the InVEST tool (Ma et al., 2016; Posner et al., 2016). The “Recreation and tourism” model provides the level of entertainment and tourism of indigenous peoples and tourists, based on how often photos taken in the research area are uploaded from the internet and on their accessibility to tourist destinations. It is assumed that higher numbers of uploaded photos can traduce attention of visitors. Besides, the “scenic quality” model provides the locations where visitors can observe the landscape. The output of the “recreation and tourism” model is based on the “scenic quality” model. The selected maximum radius from the place where the photos were taken is 8km. The final output from these two models is the attractiveness of wetland ecosystems to visitors as shown in Figure 3.
Tourism and recreation value of each ecosystem (T) are calculated as follows:
 (6)
(6)
In which, DUV6 is the total tourism and recreation value collected from the interview and statistics, Li and Ai are the wetland ecosystems attractiveness values (Fig. 3) and their respective surface area.
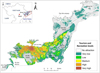 |
Fig. 3. Tourism and recreation values from wetland ecosystems in the northeastern part of Vietnam. |
2.3.3 Indirect use value
2.3.3.1 IUV1 – disaster protection value
Coastal protection systems such as dykes and embankments are often constructed to separate agricultural and rural settlements from mangrove and shallow water ecosystems (Cooper et al., 2016). In the study area, the sea dykes are entirely within the mangrove area. The coastal protection value also comes from the mangrove ecosystems located outside the dykes. Sea dykes protect inland ecosystems from storm surges and rising water. All resources inside the dyke are protected, and people's lives are guaranteed (Naganuma, 2014).
The construction cost of the coastal protection works was obtained locally from investment capital sources: district, provincial and central budgets. The project's objectives were to invest and develop sustainable coastal protective mangroves, improve forest coverage, use mangrove land effectively, create protective mangrove forests along the sea dyke’s corridor to ensure national security, protect the ecological environment, and create jobs and improve living standards for local people living in coastal areas of Quang Ninh and Hai Phong provinces. These investment-related databases were collected from the People's Committees of districts and provinces. From 2015 to 2019, the whole region had 22 projects to build anti-erosion embankments, river dikes, and to repair irrigation reservoirs for disaster prevention. The total investment value was around 87 million USD. In addition, other 13 projects with an investment value of 54 millions USD were done effectively for environmental protection and mangrove ecosystem restoration (Trung Thanh et al., 2021). All of these projects are documented in writing as well as officially announced in decisions at national and province levels. Accordingly, the total disaster protection value in the research area during five years is 141 million USD. However, all embankments, dams, dykes, culverts, canals, ditches, ports are considered as level 2 constructions (according to Circular 162/2014/TT-BTC (MOF, 2014) of the Ministry of Finance dated November 6, 2014). They have a service life of 20 years with a wear rate of 5% in 1 year. Therefore, the total cost for coastal protection was divided by 20 to calculate this value for 1 year.
2.3.3.2 IUV2 – carbon sequestration value
Carbon storage and sequestration have been considered as an indicator of global climate regulating services in various studies (Ghaley and Porter, 2014; van Oudenhoven et al., 2015). The carbon sequestration is an important ecological function of wetland forests. The Kyoto Protocol limits the amount of carbon emissions, creating a carbon market through the Clean Development Mechanism (Corbera and Brown, 2008). Various studies have been made to value wetland ecosystems contribution to carbon sequestration. Therefore, we collected the carbon sequestration values in wetland ecosystems from former studies. Particularly, Murray and Pendleton (2011) published a useful review about the carbon sequestration of different wetland ecosystems in different countries.
According to the Forest Carbon Partnership Facility (FCPF), the payment for carbon sequestration of the forest ecosystems is 11 USD/ton CO2 (Angelsen et al., 2013; Hilton, 2018). Based on the willingness to pay of related factories for the carbon sequestration, the cost that these factories have to pay for 1 ton of CO2 in the forestry sector is 258,650 VND, equivalent to about 11 USD/t CO2. USD/VND (with exchange rate: 1 USD = 23,250 VND in February, 2020) (Decision No.99/2010/ND-CP, 2010). This value is multiplied with the amount of carbon sequestrated from wetland ecosystems to achieve the total price per hectare in a year ( Table 3). This information was used as the input data to evaluate the carbon sequestration in the northeastern part of Vietnam.
Value of carbon sequestration of each wetland ecosystem in the northeastern part of Vietnam. The average price of carbon sequestration is 11 USD/ton CO2.
2.3.3.3 IUV3 – optional values
The optional value is the value measuring the willingness to pay (WTP – Willingness To Pay) for an individual wishing to conserve, restore and develop resources of the wetland ecosystem (Doherty et al., 2014). The optional value is difficult to be evaluated in terms of money because it depends heavily on the subjective opinions of each individual and the economic situation of the household. However, we calculated this option value, based on our interview results that allowed to obtain the level of people's regular payments for environmental issues. The optional value was calculated using the following formula:
 (7)
(7)
where i is the payment level (million VND); Mi is the average payment value made by a contributor at level i (million VND); The contribution levels of this fund are divided into 8 levels including: (1) no payment; (2) less than 1 USD / year; (3) 2 USD / year; (4) 3 USD / year; (5) 4 USD/year; (6) 5 USD/year; (7) from 6 to 40 USD/year; (8) over 40 USD/year. Pi is the percentage of the population who pay at level i. H is the total population of a district/region.
2.3.4 Non-use values (NUV)
The level of biodiversity and the social and cultural significance of ecosystems are often reflected in non-use values (Wam et al., 2016), and were integrated into two main value groups: bequest value and existence value which are discussed in below.
2.3.4.1 NUV1 – bequest value
The bequest value was proposed to determine the capacity to preserve, restore and develop wetland resources for future generations (Diafas et al., 2017). This is also a value that needs to be assessed through the people's willingness to pay for future generations. The method to get and process information is similar to that of the optional value mentioned above. The formula for calculating the bequest value of the district/region was calculated as in equation (7).
NUV2 – existence value
Existence value is the value that lies in the perception, feeling and satisfaction of an individual when knowing the properties of existing wetlands in a certain state and is often measured by the willingness of each individual to pay to achieve that state (de Groot et al., 2018). This value is measured based on a combination of grants from national and international nature conservation organizations during the year (Newcome et al., 2005; Wolff et al., 2015). In this study, data on investment projects aimed at conserving natural resources were collected from the People's Committees of districts and provinces in the last 5 years. The aid and investment capital sources are from the district, provincial and central budgets, and domestic and foreign units and organizations such as World Bank and Official Development Assistance (ODA) in the Climate Change Response Programs and Forest Protection and Development Program 2011-2020 (57/QD-TTg, 2010). All these funds were divided by the number of years to calculate the value for each year.
2.3.5 Total Ecosystem Service Value (ESV)
The assessment of the entire wetland ecosystem includes direct, indirect, optional and non-use values. Accordingly, the total value of ecosystem services was calculated by the following formula:
 (8)
(8)
ESV values were calculated for the seven economic regions of the northeast Vietnam region, as well as for the entire region. Based on the total value and area of each ecosystem, we calculated the ESV value for each ecosystem per hectare. After combining ecosystem distribution maps for years 2000, 2005, 2010, 2015 and 2019 and the statistics of the province, the change of the total value of WES over the past 20 years was assessed by multiplying the ESV value of each ecosystem by their area each year.
The “Planning scenario” was proposed based on the decision 1588/QĐ-UBND (1588/QĐ-UBND, 2014) of the Quang Ninh and Hai Phong provinces. According to this decision, the agricultural lands can be narrowed to 29,000 ha, whereas the mangrove area and aquaculture lands can be increased respectively to 34,000 ha and 33,700 ha by 2030 to meet economic needs and protect the environment. Based on the areal changes, the economic value of ESV was calculated to estimate a development trend of the research area in the next ten years.
3 Results
3.1 ESV of each wetland ecosystem
The ESV of each wetland types per hectare in the research area in 2019 is shown in Table 4. The average WES value in one hectare reaches 1040 USD per year. Seven wetland ecosystems can be separated into three groups based on their economic benefits to humans. Particularly, the aquaculture and farm ponds in the first group provide the highest economic value (2120 USD/ha/year) according to high-technological aquaculture production, carbon sequestration and option values. The second group which includes (1) marine subtidal aquatic bed and sand/shingle shores, (2) estuarine waters, and (3) agricultural lands provide more than 1770 USD/ha/year. Based on high benefits from capture fisheries, intensive aquaculture production, tourism and recreation, the marine subtidal aquatic bed and sand/shingle shores provide about 1800 USD/ha/year. In the third group, although intertidal forested wetland ecosystems contain high potential benefits related to the IUV and NUV values, their areas are narrowed, leading to their WEV reaches 1,070 USD/ha/year. The shallow marine waters have the lowest WES value with 390 USD/ha/year with the benefits mainly from the tourism and recreation.
Ecosystem service values of each wetland types in the northeastern part of Vietnam in 2019 (Unit: Thousand USD per year).
3.2 ESV in the northeastern part of Vietnam
The total WES value of all regions in the Northeastern part of Vietnam reaches more than 392 million USD/year ( Tab. 5). This value mainly comes from the DUV value with 89% in total. The wetland ecosystems in Quang Yen district provide more than 1880 USD/ha/year, followed by those in Cam Pha district and Cua Luc bay with more than 1440 USD/ha/year. The other regions provide from 700 to 900 USD/ha/year. The wetland ecosystems from Mong Cai city to Van Don district, mainly represented by rocky marine shores and narrow estuaries provided the lowest WES value. In contrast, the local people in Quang Yen and Cam Pha districts receive large incomes from fisheries and aquaculture production, tourism and recreation, leading to the highest WES value.
Ecosystem service values in seven regions of the Northeastern part of Vietnam in 2019 (Unit: Thousand USD per year).
3.3 Changes of WES during twenty years
Based on the land use/cover maps from the years 2000 to 2019 and the average use value from each wetland ecosystem, the fluctuation of use value over 20 years is depicted in Figure 4. The degradation of the use value is a result of the conversion from traditional agricultural and aquaculture production to intensive ones. In general, the total use value in the northeastern part of Vietnam has decreased since 2005, although the economic values of intensive aquaculture farming activities have significantly increased. In particular, the incomes of aquaculture farmers increased from 9000 USD/year in 2005 to more than 45,000 USD/year in 2019. The total ESV obtained from the agricultural lands were increased from 25 million USD in 2000 to more than 40 million USD in 2019. In contrast, the area of agricultural ecosystems significantly decreased, leading to a concomitant decrease in their economic benefits from 73 to 59 million USD. The area of intertidal forested wetlands has decreased slightly from years 2000 to 2010, but has recovered since 2019. Therefore, intertidal forested wetlands values remained overall stable at around 19 million USD. In contrast to the reduction of use values in marine subtidal aquatic beds, sand/pebbles shores, and estuarine waters, the use value of aquaculture ecosystems increased more than twice from years 2000 to 2019. Based on the province’s planning, the expanding of the aquaculture lands and narrowing of agricultural lands although can increase the incomes of local people, the total ESV of whole region can be decreased about three percent, from 390 to 380 million USD.
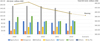 |
Fig. 4. Changes of use values obtained from wetland ecosystems over 20 years and prediction in province’s planning till 2030 in the Northeastern part of Vietnam. |
4 Discussion
This study is the first to synthesize 11 types of wetland ecosystem services values for seven regions in the northeastern coastal strip of Vietnam. The evaluation of some direct values such as aquaculture, marine resources, medicinal plants and tourism was more complementary and up-to-date than that of other previous researches carried out in Tien Yen, Van Uc estuary and some inland wetland ecosystems (McDonough et al., 2014; Talberth, 2015). Specifically, the total economic cost of wetlands in Van Uc estuary estimated in this study is 0.93 thousand USD/ha/year, higher than the result of Mai et al. (2003) with the value of is 0.71 thousand USD/ha/year. The wetland area in the Dong Rui island in Tien Yen district brought 0.84 thousand USD/ha/year in this study, a value higher than the value of 0.75 thousand USD/ha/year calculated by Mai et al. (2003). The evaluations made in previous studies often lacked synchronization, especially with option, existence and circulated values, which decreased the ESV value of each ecosystem.
The results show that 100% of the interviewees are aware of the benefits and value of wetlands for their livelihoods. In the coastal wetlands from Quang Ninh to Hai Phong, the provided values included fisheries, tourism development, agriculture, livestock raising and beekeeping. In the Northern part of Vietnam, wetlands represent one of the four major fishing grounds of Vietnam, because hosting high species diversity and biomass. Fisheries are mainly concentrated in estuaries, canals, tidal flats, mangroves and ponds in the Quang Ninh – Hai Phong provinces. These fisheries include shrimps, crabs, fishes, squid, and other mollusks such as clams and mussels. Especially, the Van Don district has a favorable environment for mollusk species and has been planned to become the largest mollusk farming place in the Quang Ninh province. According to the interviews, current fishing activities have caused serious water pollution, especially in ports. The local people are aware of the limited coastal resources. However, it is necessary to have more studies to analyze the tourism and fishing capacities in this wetland area to minimize the effects of aquaculture and other economic development in the future.
Beekeeping in mangroves, together with fishing, is a new livelihood that helps local people earn high economic income. People in the northeastern coastal provinces of Vietnam not only develop and protect the mangrove forest system, but also take advantage of the flower season to exploit honey and create favorable conditions for the development of beekeeping in the mangroves. On average, each year, a colony of bees can bring each household 15–20 liters of natural honey. With an average price of 5 USD/liter, income from selling honey is about 5000–7000 USD/year, without considering the income from selling bees for 50 USD/swarm. Beekeepers are very conscious of the interest to protect mangroves to bring long-term and sustainable economic benefits. Therefore, taking care of bees has the same meaning as taking care of mangroves. In other words, the beekeepers play the same role as rangers.
In Quang Ninh province, agriculture is not the main economic sector (accounting for only 5% of the province's economic structure), but this sector has a decisive role in the life and socio-economy of local people. 70% of the interviewed households mentioned needing rice land to support daily activities. However, agricultural activities in rice cultivation tend to decrease due to low economic efficiency. Instead, people are gradually changing their crops structure from rice land to fruit trees and organic vegetables growing. In addition, the raising of aquatic birds in several districts is also getting more attention, especially commercial sea ducks raising as providing a great source of income for local people.
In terms of ability to regulate natural hazards, 65% of the respondents highly appreciated the role of wetlands in limiting flooding and soil erosion. However, due to the short and steep estuary system in Quang Ninh, the flow rate is high and often causes soil erosion, increasing the amount of silt and rock, especially during big floods. Such silt and rock in many places fill up rivers and streams very quickly, especially in areas with coal mining activities such as in the Mong Duong River, the Cam Pha city and Quang Ninh province. Consequently, investment projects for environmental protection and disaster prevention are planned during the next 5 years with huge capital sources ranging from several billions to trillions of VND. The use value of these future infrastructures is classified as 2nd level architecture, so that they will be used for 10–20 years with a depreciation value of 5–10% according to Circular No. 45/2018/TT-BTC dated May 7, 2018 (MOF, 2018) and Circular No. 162/2014/TT-BTC of the Ministry of Finance dated November 6, 2014 (MOF, 2014). It is important information to calculate correctly the ESV value for all constructions in one year.
Concerning transmission and option values, they are measured based on the “subjective” answers from local people. Therefore, it is difficult to evaluate their monetary values. In this study, the level of households' willingness to pay for current and future goals was used to evaluate these values. Results partly reflect people's perception of the role of wetland ecosystems in local life and environmental protection. 48% of interviewees whose livelihoods depend directly on wetlands agree to make financial contributions to conservation, restoration and development of local resources activities. Meanwhile, 52% of interviewees have doubts about the province managers’ performance, therefore disagreeing to contribute to sustainability development activities in the wetland areas.
5 Conclusions
Based on the integration of different quantitative methods, the economic benefits obtained from seven wetland ecosystems in the northeastern part of Vietnam were clearly valuated. 11 service types could be identified in the wetland ecosystems. The local people in the research area received the largest economic benefits from the marine subtidal aquatic and sand/shingle ecosystems. On a per-hectare basis, the aquaculture ecosystems provide the highest value, whereas the shallow marine waters provide the lowest value. In 2019, the wetland ecosystems in the northeastern part of Vietnam are worth the equivalent of over 390 million USD per year. This value was reduced by nearly 15% since the year 2000, and can decrease three percent more by 2030 if the planning of the local managers is completed. To avoid this degradation of ESV in the future, the economic development in the research area requires an improvement of the indirect use values, especially in the marine subtidal aquatic bed, estuarine, and intertidal forested wetland ecosystems, toward a balance between environmental conservation and economic development. The methods and outcomes of this study can be applied for other wetland areas in Vietnam, as well as in other countries in the future.
Acknowledgements
This research was funded by Vietnam National Foundation for Science and Technology Development (NAFOSTED) under grant number 105.07-2020.04.
References
- QĐ-UBND. 2014. Decision: Approval of regional construction planning of Quang Ninh province to 2030, with a vision to 2050 and outside 2050. 10 pp. [Google Scholar]
- QD-TTg. 2010. Decision No. 57/QD-TTg of January 12, 2010, approving the placement of cultural attachés in a number of key foreign countries. 10 pp. [Google Scholar]
- Almeida CMVB, Mariano MV, Agostinho F, et al. 2018. Comparing costs and supply of supporting and regulating services provided by urban parks at different spatial scales. Ecosyst Serv 30: 236–247. [CrossRef] [Google Scholar]
- Angelsen A., Herold M., Verchot L., Hänsel G. 2013. Testing methodologies for REDD+: Deforestation drivers, costs and reference levels. 138 pp. [Google Scholar]
- Arunrat O., Pumijumnong N. 2017. Practices for Reducing Greenhouse Gas Emissions from Rice Production in Northeast Thailand. Agriculture 7: 20. [Google Scholar]
- Barbier E.B., Koch E.W., Silliman B.R., Hacker S.D., Wolanski E., Primavera J. 2008. Coastal ecosystem-based management with nonlinear ecological functions and values. Science 319: 321–323. [CrossRef] [PubMed] [Google Scholar]
- Baveye P.C., Baveye J., Gowdy J. 2016. Soil “ecosystem” services and natural capital: critical appraisal of research on uncertain ground. Front Environ Sci 4(June): 1–49. [CrossRef] [Google Scholar]
- Bayne B.L. 2017. Oysters and the Ecosystem. 703–834 pp. [Google Scholar]
- Bui T.D., Maier S.W., Austin C.M. 2014. Land cover and land use change related to shrimp farming in coastal areas of Quang Ninh, Vietnam using remotely sensed data. Environ Earth Sci 72: 441–455. [CrossRef] [Google Scholar]
- Burkhard B., Kandziora M., Hou Y., Müller F. 2014. Ecosystem service potentials, flows and demands-concepts for spatial localisation, indication and quantification. Landscape Online 34: 1–32. [CrossRef] [Google Scholar]
- CBD. 2015. Wetlands and Ecosystem Services. United Nations 10 pp. [Google Scholar]
- Champ P.A., Boyle K.J., Brown T.C. 2003. A Primer on Nonmarket Valuation. New York: Springer Science+ Business Media. 578 pp. [Google Scholar]
- Chen N., Li H., Wang L. 2009a. A GIS-based approach for mapping direct use value of ecosystem services at a county scale: management implications. Ecol Econ 68: 2768–2776. [CrossRef] [Google Scholar]
- Chen Z.M., Chen G.Q., Chen B., Zhou J.B., Yang Z.F., Zhou Y. 2009b. Net ecosystem services value of wetland: Environmental economic account. Commun Nonlinear Sci Numer Simul 14: 2837–2843. [CrossRef] [Google Scholar]
- Cooper J.A.G., O’Connor M.C., McIvor S. 2016. Coastal defences versus coastal ecosystems: a regional appraisal. Marine Policy: 1–12. [Google Scholar]
- Corbera E., Brown K. 2008. Building institutions to trade ecosystem services: marketing forest carbon in Mexico. World Dev 36: 1956–1979. [CrossRef] [Google Scholar]
- Costanza R., de Groot R., Sutton P., et al. 2014. Changes in the global value of ecosystem services. Glob Environ Change 26: 152–158. [CrossRef] [Google Scholar]
- Dang K.B., Nguyen M.H., Nguyen D.A., et al. 2020. Coastal wetland classification with deep u-net convolutional networks and sentinel-2 imagery: a case study at the tien yen estuary of vietnam. Remote Sens 12: 1–26. [Google Scholar]
- Dang K.B., Windhorst W., Burkhard B., Müller F. 2019. A Bayesian Belief Network – based approach to link ecosystem functions with rice provisioning ecosystem services. Ecol Indic 100: 30–44. [CrossRef] [Google Scholar]
- Davis A.Y., Lonsdorf E.V., Shierk C.R., et al. 2017. Enhancing pollination supply in an urban ecosystem through landscape modifications. Lands Urban Plan 162: 157–166. [CrossRef] [Google Scholar]
- Dean W.E., Gorham E. 1998. Magnitude and significance of carbon burial in lakes, reservoirs, and peatlands. Ecol Evol Behav 26: 535–538. [Google Scholar]
- Defra. 2007. An introductory guide to valuing ecosystem services. Department for Environment, Food and Rural Affairs. 68 pp. (also available at www.defra.gov.uk). [Google Scholar]
- Diafas I., Barkmann J., Mburu J. 2017. Measurement of bequest value using a non-monetary payment in a choice experiment — the case of improving forest ecosystem services for the bene fi t of local communities in rural Kenya. Ecol Econ 140: 157–165. [CrossRef] [Google Scholar]
- Doherty E., Murphy G., Hynes S., Buckley C. 2014. Valuing ecosystem services across water bodies : Results from a discrete choice experiment. Ecosyst Serv 7: 89–97. [CrossRef] [Google Scholar]
- Friess D.A. 2016. Ecosystem services and disservices of mangrove forests: insights from historical colonial observations. Forests 7(9). [Google Scholar]
- Froehlich H.E., Gentry R.R., Halpern B.S. 2017. Conservation aquaculture: shifting the narrative and paradigm of aquaculture’s role in resource management. Biol Conserv 215: 162–168. [CrossRef] [Google Scholar]
- Gao Y., He N., Zhang X. 2014. Effects of reactive nitrogen deposition on terrestrial and aquatic ecosystems. Ecol Eng 70: 312–318. [CrossRef] [Google Scholar]
- Ghaley B.B., Porter J.R. 2014. Ecosystem function and service quantification and valuation in a conventional winter wheat production system with DAISY model in Denmark. Ecosyst Serv 10: 79–83. [CrossRef] [Google Scholar]
- de Groot D., Brander L., Max Finlayson C. 2018. Wetland ecosystem services. The Wetland Book: I: Structure and Function, Management, and Methods: 323–333. [CrossRef] [Google Scholar]
- Guo M., Li J., Sheng C., Xu J., Wu L. 2017. A review of wetland remote sensing. Sensors (Switzerland) 17: 1–36. [Google Scholar]
- Haines-Young R. 2011. Exploring ecosystem service issues across diverse knowledge domains using Bayesian Belief Networks. Prog Phys Geogr 35: 681–699. [CrossRef] [Google Scholar]
- Hardman C.J., Norris K., Nevard T.D., Hughes B., Potts S.G. 2016. Delivery of floral resources and pollination services on farmland under three different wildlife-friendly schemes. Agric Ecosyst Environ 220: 142–151. [CrossRef] [Google Scholar]
- He J., Sikor T. 2015. Land Use Policy Notions of justice in payments for ecosystem services: insights from China’s Sloping Land Conversion Program in Yunnan Province. Land Use Policy 43: 207–216. [CrossRef] [Google Scholar]
- Hilton S. 2018. Climate Change and Financial Risk. 87 pp. [Google Scholar]
- Hoang V.T., Le D.D. 2006. Wetland classification system in Vietnam. CRES, Viet edition. Hanoi, Vietnam Environment Administration. 88 pp. [Google Scholar]
- Kubalíková L. 2020. Cultural ecosystem services of geodiversity: a case study from Stranska skala (Brno, Czech Republic). Land 9: 22–24. [CrossRef] [Google Scholar]
- Kubiszewski I., Anderson S.J., Costanza R., Sutton P.C. 2016. The future of ecosystem services in Asia and the Pacific. Asia Pacific Policy Stud 3: 389–404. [CrossRef] [Google Scholar]
- Lan T.D. 2009. Assessment of some marine ecosystems using sustainable utilization indicators in Hai Phong-Quang Ninh coastal area, Vietnam. Aquat Ecosyst Health Manag 12: 243–248. [CrossRef] [Google Scholar]
- Le T.A. 2015. Situation Analysis of the Water Quality of Ha Long Bay, Quang Ninh Province, Vietnam: A social study from tourism businesses’ perspectives. Gland, Switzerland: IUCN: 46. [Google Scholar]
- Liquete C., Udias A., Conte G., Grizzetti B., Masi F. 2016. Integrated valuation of a nature-based solution for water pollution control. Highlighting hidden bene fi ts. Ecosyst Serv 22 (December 2015): 392–401. [CrossRef] [Google Scholar]
- Ma S., Duggan J.M., Eichelberger B.A., et al. 2016. Valuation of ecosystem services to inform management of multiple-use landscapes. Ecosyst Serv 19: 6–18. [CrossRef] [Google Scholar]
- Mai T., Smith C. 2018. Scenario-based planning for tourism development using system dynamic modelling: a case study of Cat Ba Island, Vietnam. Tour Manag 68(April 2016): 336–354. [CrossRef] [Google Scholar]
- Mai T.N., Nguyen H.N., Luong Q.H., et al. 2003. Economic valuation of demonstration wetland sites in Vietnam. VNU J Sci: Earth Environ Sci 27. [Google Scholar]
- Maynard S., James D., Davidson A. 2015. Determining the value of multiple ecosystem services in terms of community wellbeing: who should be the valuing agent? Ecol Econ 115: 22–28. [CrossRef] [Google Scholar]
- McDonough S., Gallardo W., Berg H., Trai N.V., Yen N.Q. 2014. Wetland ecosystem service values and shrimp aquaculture relationships in Can Gio, Vietnam. Ecol Indic 46: 201–213. [CrossRef] [Google Scholar]
- Meng L., Dong J. 2019. LUCC and ecosystem service value assessment for wetlands: a case study in Nansi Lake, China. Water (Switzerland) 11(8). [Google Scholar]
- Merriman L.S., Hunt W.F., Bass K.L. 2016. Development/ripening of ecosystems services in the first two growing seasons of a regional-scale constructed stormwater wetland on the coast of North Carolina. Ecol Eng 94: 393–405. [CrossRef] [Google Scholar]
- MOF. 2014. Circulars 162/2014/TT-BTC: Regulation on management and accountability of fixed assets in state authorities, public non-business units and organizations that use the state budget. 10 pp. [Google Scholar]
- MOF. 2018. No.45/2018/TT-BTC: On guiding the regime for managing and calculating depreciation of fixed assets of agencies, organizations or units and fixed assets handed to enterprises by the state without calculation of the state capital portion of such enterprises. Hanoi, Ministry of Finance in Vietnam. [Google Scholar]
- Moore T.L.C., Hunt W.F. 2012. Ecosystem service provision by stormwater wetlands and ponds – a means for evaluation? Water Res 46: 6811–6823. [CrossRef] [PubMed] [Google Scholar]
- Murray B.C., Pendleton L. 2011. Green payments for blue carbon: Economic incentives for protecting threatened coastal habitats. Duke University [Google Scholar]
- Naganuma K. 2014. Environmental Planning of Quang Ninh province of 2020 vision to 2030. 395 pp. [Google Scholar]
- Nahuelhual L., Carmona A., Lozada P., Jaramillo A., Aguayo M. 2013. Mapping recreation and ecotourism as a cultural ecosystem service: An application at the local level in Southern Chile. Appl Geogr 40: 71–82. [CrossRef] [Google Scholar]
- Newcome J., Provins A., Johns H., Ozdemiroglu E., Ghazoul J., Burgess D. 2005. The Economic, Social and Ecological Value of Ecosystem Services: A Literature Review. London 47 pp. [Google Scholar]
- Newton A.C., Hodder K., Cantarello E., et al. 2012. Cost-benefit analysis of ecological networks assessed through spatial analysis of ecosystem services. J Appl Ecol 49: 571–580. [CrossRef] [Google Scholar]
- No.99/2010/ND-CP. 2010. Decree on the policy on payment for forest environment services. The government of socialist republic of Vietnam (99): 11. (also available at http://vietnam-redd.org/Upload/Download/File/99-2010-ND-CP_EN_2332.pdf). [Google Scholar]
- van Oudenhoven A.P.E., Siahainenia A.J., Sualia I., et al. 2015. Effects of different management regimes on mangrove ecosystem services in Java, Indonesia. Ocean Coastal Manag 116: 353–367. [CrossRef] [Google Scholar]
- Pascual U., Muradian R., Brander L., et al. 2010. Chapter 5 The economics of valuing ecosystem services and biodiversity. Econ Ecosyst Biodivers (January): 183–255. [Google Scholar]
- Pennington D.N., Dalzell B., Nelson E., et al. 2017. Cost-effective land use planning: optimizing land use and land management patterns to maximize social benefits. Ecol Econ 139: 75–90. [CrossRef] [Google Scholar]
- Posner S., Verutes G., Koh I., Denu D., Ricketts T. 2016. Global use of ecosystem service models. Ecosyst Serv 17: 131–141. [CrossRef] [Google Scholar]
- Pröbstl-Haider U. 2015. Cultural ecosystem services and their effects on human health and well-being – a cross-disciplinary methodological review. J Outdoor Recreat Tourism 10: 1–13. [CrossRef] [Google Scholar]
- RAMSAR. 2010. Wetlands: a global disappearing act. 2 pp. (also available at www.ramsar.org). [Google Scholar]
- Ramsar Convention Secretariat. 2016. An Introduction to the Ramsar Convention on Wetlands. 108 pp. (also available at https://www.mendeley.com/viewer/?fileId=658dea6f-a739-d995-65b0-e9d2a5a9f4c6&documentId=158ad1b6-0317-3653-ac6d-fb0139511534). [Google Scholar]
- Redhead J.W., Stratford C., Sharps K., et al. 2016. Empirical validation of the InVEST water yield ecosystem service model at a national scale. Sci Total Environ 569–570: 1418–1426. [CrossRef] [PubMed] [Google Scholar]
- Sannigrahi S., Chakraborti S., Joshi P.K., et al. 2019. Ecosystem service value assessment of a natural reserve region for strengthening protection and conservation. J Environ Manag 244(April): 208–227. [CrossRef] [Google Scholar]
- Sondak C.F.A., Chung I.K. 2015. Potential blue carbon from coastal ecosystems in the Republic of Korea. Ocean Sci J 50: 8. [Google Scholar]
- Sun B., Lei Y., Cui L., Li W., Kang X., Zhang M. 2018. Addressing the modelling precision in evaluating the ecosystem services of coastal wetlands. Sustainability (Switzerland) 10: 8–10. [Google Scholar]
- Tajima Y., Gunasekara K., Nguyen H.T. 2019. Satellite-based monitoring of contrasting characteristics of suspended sediment discharged from the Red and the Ma river systems along the northern coast of Vietnam. Int J Sediment Res 34: 191–204. [CrossRef] [Google Scholar]
- Talberth J. 2015. Valuing Ecosystem Services in the Lower Mekong Basin : Country Report for Vietnam. (March): 33 pp. [Google Scholar]
- Thai T.H., Thuy N.B., Dang V.H., Kim S., Hole L.R. 2017. Impact of the interaction of surge, wave and tide on a storm surge on the north coast of Vietnam. Proc IUTAM 25: 82–91. [CrossRef] [Google Scholar]
- Thao N. Van, Bao D. Van, Lan T.D. 2013. Distributive Change of Typical Ecosystems in the Quang Ninh Coastal Area. Tạp chí Khoa học và Công nghệ Biển 13(4). [Google Scholar]
- Thi Kim Chi T., Clausen J.H., Van P.T., Tersbøl B., Dalsgaard A. 2017. Use practices of antimicrobials and other compounds by shrimp and fish farmers in Northern Vietnam. Aquac Rep 7(June): 40–47. [CrossRef] [Google Scholar]
- Thuy P.T., Phuong V.T., Chien P.D., et al. 2019. Opportunities and challenges for mangrove management in Vietnam: Lessons learned from Thanh Hoa, Thai Binh and Quang Ninh provinces. Bogor, Indonesia, Center for International Forestry Research (CIFOR). 69 pp. https://doi.org/10.17528/cifor/007404 [Google Scholar]
- Tong S.S., Deroin J.P., Pham T.L. 2020. An optimal waterline approach for studying tidal flat morphological changes using remote sensing data: A case of the northern coast of Vietnam. Estuarine, Coastal and Shelf Science 236(January): 106613. [CrossRef] [Google Scholar]
- Trung Thanh H., Tschakert P., Hipsey M.R. 2021. Moving up or going under? Differential livelihood trajectories in coastal communities in Vietnam. World Dev 138: 105219. [CrossRef] [Google Scholar]
- Tseng M.-L., Chiu A.S.F., Nguyen Vo M.P. 2011. Evaluating the tourist’s demand to develop Vietnamese tourism performance. Procedia 25: 311–326. [Google Scholar]
- Tseng M.L., Wu K.J., Lee C.H., Lim M.K., Bui T.D., Chen C.C. 2018. Assessing sustainable tourism in Vietnam: a hierarchical structure approach. J Cleaner Prod 195: 406–417. [CrossRef] [Google Scholar]
- Tue N.T., Nguyen P.T., Quan D.M., et al. 2018. Sedimentary composition and organic carbon sources in mangrove forests along the coast of northeast Vietnam. Regl Stud Marine Sci 17: 87–94. [CrossRef] [Google Scholar]
- Turpie J., Lannas K., Scovronick N., Louw A. 2010. Wetland Valuation Volume I. Wetland Ecosystem Services and Their Valuation: A Review of Current Understanding and Practice. 132 pp. [Google Scholar]
- Vieira da Silva L., Everard M., Shore R.G. 2014. Ecosystem services assessment at Steart Peninsula, Somerset, U.K. Ecosyst Serv 10: 19–34. [CrossRef] [Google Scholar]
- Vo Q.T., Kuenzer C., Vo Q.M., Moder F., Oppelt N. 2012. Review of valuation methods for mangrove ecosystem services. Ecol Indic 23: 431–446. [CrossRef] [Google Scholar]
- Wam H.K., Bunnefeld N., Clarke N., Hofstad O. 2016. Conflicting interests of ecosystem services: Multi-criteria modelling and indirect evaluation of trade-offs between monetary and non-monetary measures. Ecosyst Serv 22(August): 280–288. [CrossRef] [Google Scholar]
- Waycott M., Duarte C.M., Carruthers T.J., Orth R.J., Dennison W.C., Olyarnik S. 2009. Accelerating loss of seagrasses across the globe threatens coastal ecosystems. Proc Natl Acad Sci 106: 12377–12381. [CrossRef] [PubMed] [Google Scholar]
- Wolff S., Schulp C.J.E., Verburg P.H. 2015. Mapping ecosystem services demand: a review of current research and future perspectives. Ecol Indic 55: 159–171. [CrossRef] [Google Scholar]
- Xu X., Chen M., Yang G., Jiang B., Zhang J. 2020. Wetland ecosystem services research: a critical review. Glob Ecol Conserv 22: e01027. [CrossRef] [Google Scholar]
- Yee S.H., Dittmar J.A., Oliver L.M. 2014. Comparison of methods for quantifying reef ecosystem services: A case study mapping services for St. Croix, USVI. Ecosyst Serv 8: 1–15. [CrossRef] [Google Scholar]
- Zhou J., Wu J., Gong Y. 2020. Valuing wetland ecosystem services based on benefit transfer: a meta-analysis of China wetland studies. J Cleaner Prod 276: 122988. [CrossRef] [Google Scholar]
- Zorrilla-Miras P., Palomo I., Gómez-Baggethun E., Martín-López B., Lomas P.L., Montes C. 2014. Effects of land-use change on wetland ecosystem services: a case study in the Doñana marshes (SW Spain). Landsc Urban Plan 122: 160–174. [CrossRef] [Google Scholar]
Cite this article as: Dang KB, Phan TTH, Nguyen TT, Pham TPN, Nguyen MH, Dang VB, Hoang TTH, Ngo VL. 2022. Economic valuation of wetland ecosystem services in northeastern part of Vietnam. Knowl. Manag. Aquat. Ecosyst., 423, 12.
All Tables
Wetlands classification system for the Northeastern part of Vietnam , based on RAMSAR, MONRE, modified from (Dang et al., 2020; Guo et al., 2017; Hoang and Le, 2006).
The list of 15 main questions related to different kinds of local livelihoods in wetland ecosystems.
Value of carbon sequestration of each wetland ecosystem in the northeastern part of Vietnam. The average price of carbon sequestration is 11 USD/ton CO2.
Ecosystem service values of each wetland types in the northeastern part of Vietnam in 2019 (Unit: Thousand USD per year).
Ecosystem service values in seven regions of the Northeastern part of Vietnam in 2019 (Unit: Thousand USD per year).
All Figures
|
Fig. 1. Wetland ecosystems in the northeastern part of Vietnam (adapted from (Dang et al., 2020)). |
| In the text | |
|
Fig. 2. Groups of economic values for wetland ecosystems in the northeastern coastal area of Vietnam. |
| In the text | |
|
Fig. 3. Tourism and recreation values from wetland ecosystems in the northeastern part of Vietnam. |
| In the text | |
|
Fig. 4. Changes of use values obtained from wetland ecosystems over 20 years and prediction in province’s planning till 2030 in the Northeastern part of Vietnam. |
| In the text | |
Current usage metrics show cumulative count of Article Views (full-text article views including HTML views, PDF and ePub downloads, according to the available data) and Abstracts Views on Vision4Press platform.
Data correspond to usage on the plateform after 2015. The current usage metrics is available 48-96 hours after online publication and is updated daily on week days.
Initial download of the metrics may take a while.