Fig 3
Download original image
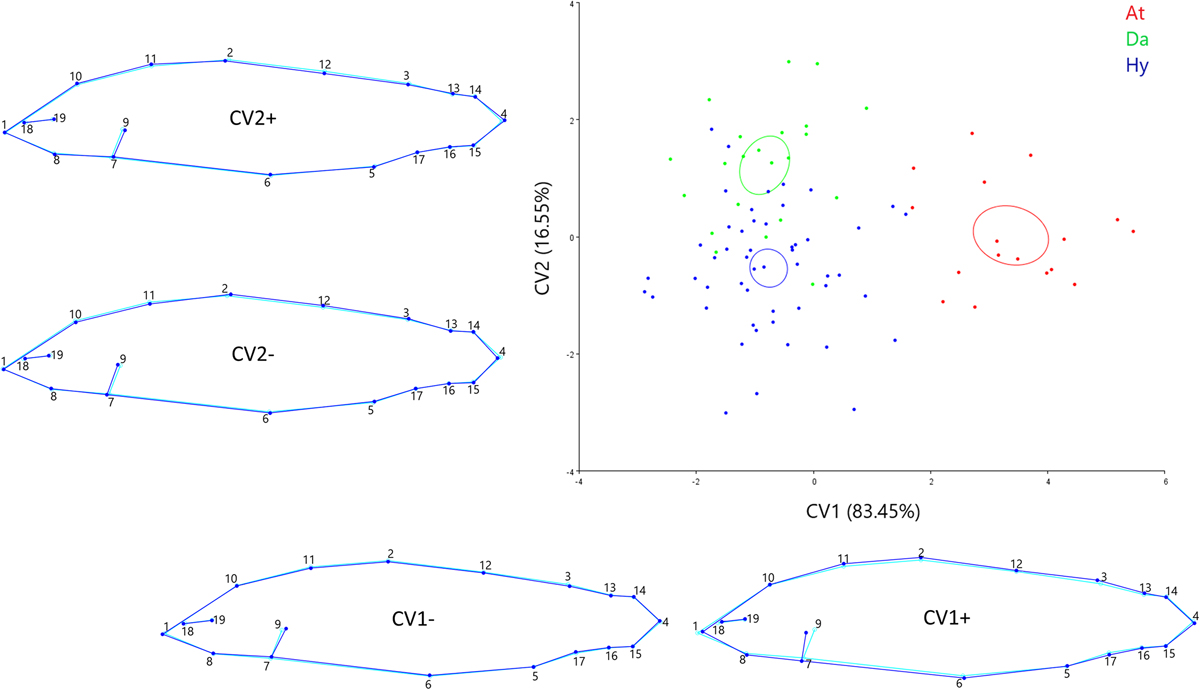
Scatterplot of the first two canonical variate axes of CVA depicting trout shape variation, including mean ellipses. Wireframe graphs with 19 marked landmarks represent shape change along the first and second CV axes, from negative to positive extremes. Light blue outlines represent the average shape and dark blue outlines represent extreme shape changes. At − Atlantic lineage, Da − Danubian lineage, Hy − hybrid.
Current usage metrics show cumulative count of Article Views (full-text article views including HTML views, PDF and ePub downloads, according to the available data) and Abstracts Views on Vision4Press platform.
Data correspond to usage on the plateform after 2015. The current usage metrics is available 48-96 hours after online publication and is updated daily on week days.
Initial download of the metrics may take a while.