Fig. 5
Download original image
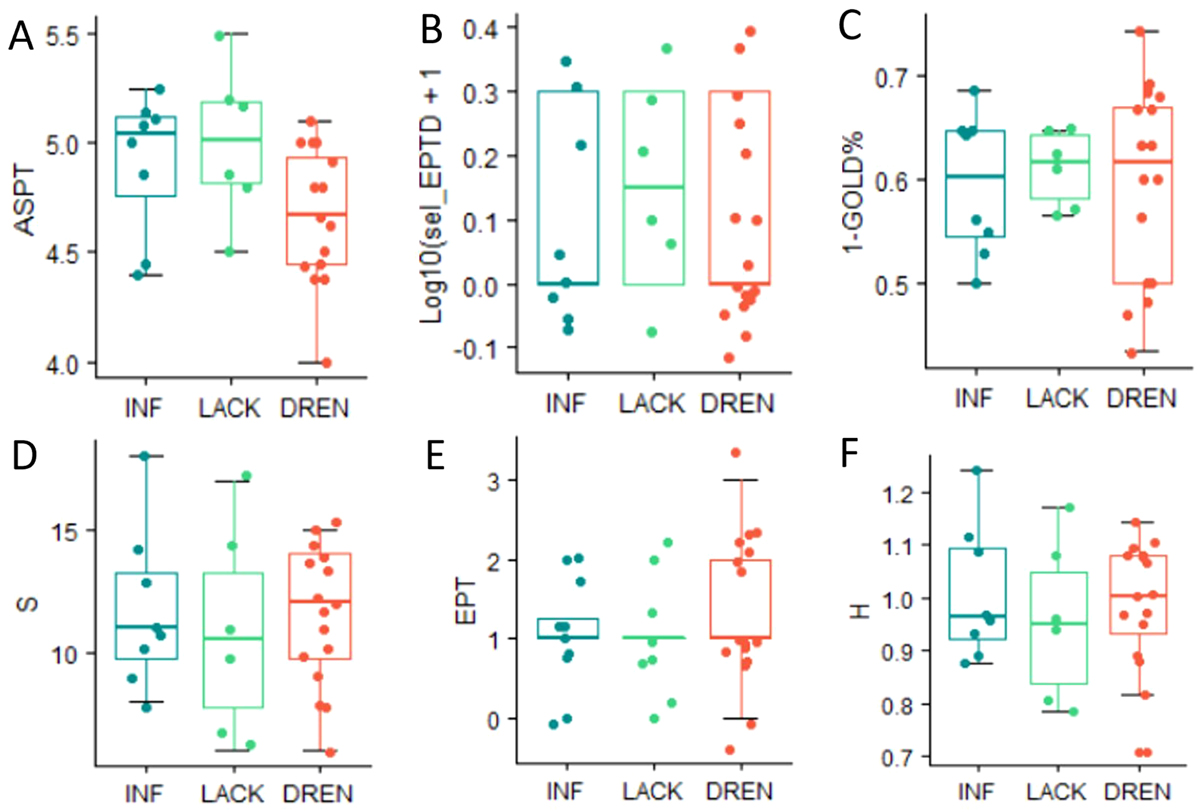
A − average score per taxon (ASPT; consistent with the scoring scale of BMWP_PL after Klimaszyk and Trawiński, 2007); B − log10 of the sum of individuals from selected families: Heptageniidae, Ephemeridae, Leptophlebiidae, Brachycentridae, Goeridae, Polycentropodidae, Limnephilidae, Odontoceridae, Dolichopodidae, Stratiomyidae, Dixidae, Empididae, Athericidae, Nemouridae +1, C − 1–GOLD% = 1–(frequency, i.e. % of the number of individuals from group of families Gastropoda + Oligochaeta + Diptera); D − the number of all families found in a given sampling location; E − number of organisms in orders: Ephemeroptera, Plecoptera and Trichoptera) found in a given sampling location; F − Shannon-Wiener diversity index. Solid line within the boxes represent average value. Box covers 25-75 percentiles of the parameter values distribution. Whiskers stand for 5-95 percentiles of the parameter values distribution.
Current usage metrics show cumulative count of Article Views (full-text article views including HTML views, PDF and ePub downloads, according to the available data) and Abstracts Views on Vision4Press platform.
Data correspond to usage on the plateform after 2015. The current usage metrics is available 48-96 hours after online publication and is updated daily on week days.
Initial download of the metrics may take a while.