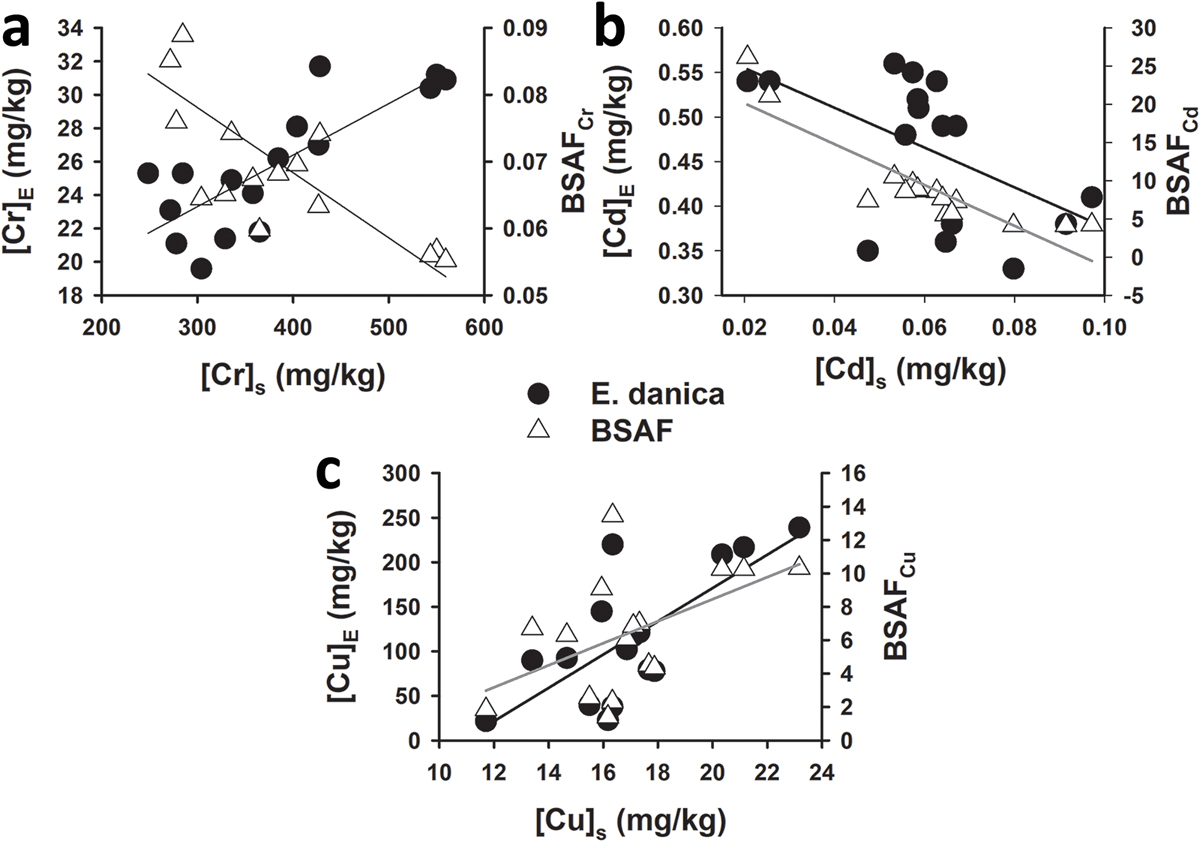
Fig. 3
Download original image
Effects of metal concentration in the sediment on metal concentration in E. danica and its BSAF. (A) Effect of changes in Cr concentration in the sediment (Crs) during the investigation period on its concentration in E. danica (CrE, black circles) and BSAF (CrB, open triangles) at the investigated localities on the Skrapež River. The black solid line represents the linear fit of the data in the case of CrE (R = 0.80, P < 0.001) and the grey one in the case of CrB (R = –0.77, P < 0.001). (B) Effect of changes in Cd concentration in the sediment (Cds) during the investigation period on its concentration in E. danica (CdE, black circles) and BSAF (CdB, open triangles) at the investigated localities on the Skrapež River. The black solid line represents the linear fit of the data in the case of CdE (R = –0.54, P = 0.030) and the grey one in the case of CdB (R = –0.88, P < 0.001). (C) Effect of changes in Cu concentration in sediment (Cus) during the investigation period on its concentration in E. danica (CuE, black circles) and BSAF (CuB, open triangles) at the investigated localities on the Skrapež River. The black solid line represents the linear fit of the data in the case of CuE (R = 0.72, P = 0.002) and the grey one in the case of CdB (R = 0.53, P = 0.036).
Current usage metrics show cumulative count of Article Views (full-text article views including HTML views, PDF and ePub downloads, according to the available data) and Abstracts Views on Vision4Press platform.
Data correspond to usage on the plateform after 2015. The current usage metrics is available 48-96 hours after online publication and is updated daily on week days.
Initial download of the metrics may take a while.