Fig. 1
Download original image
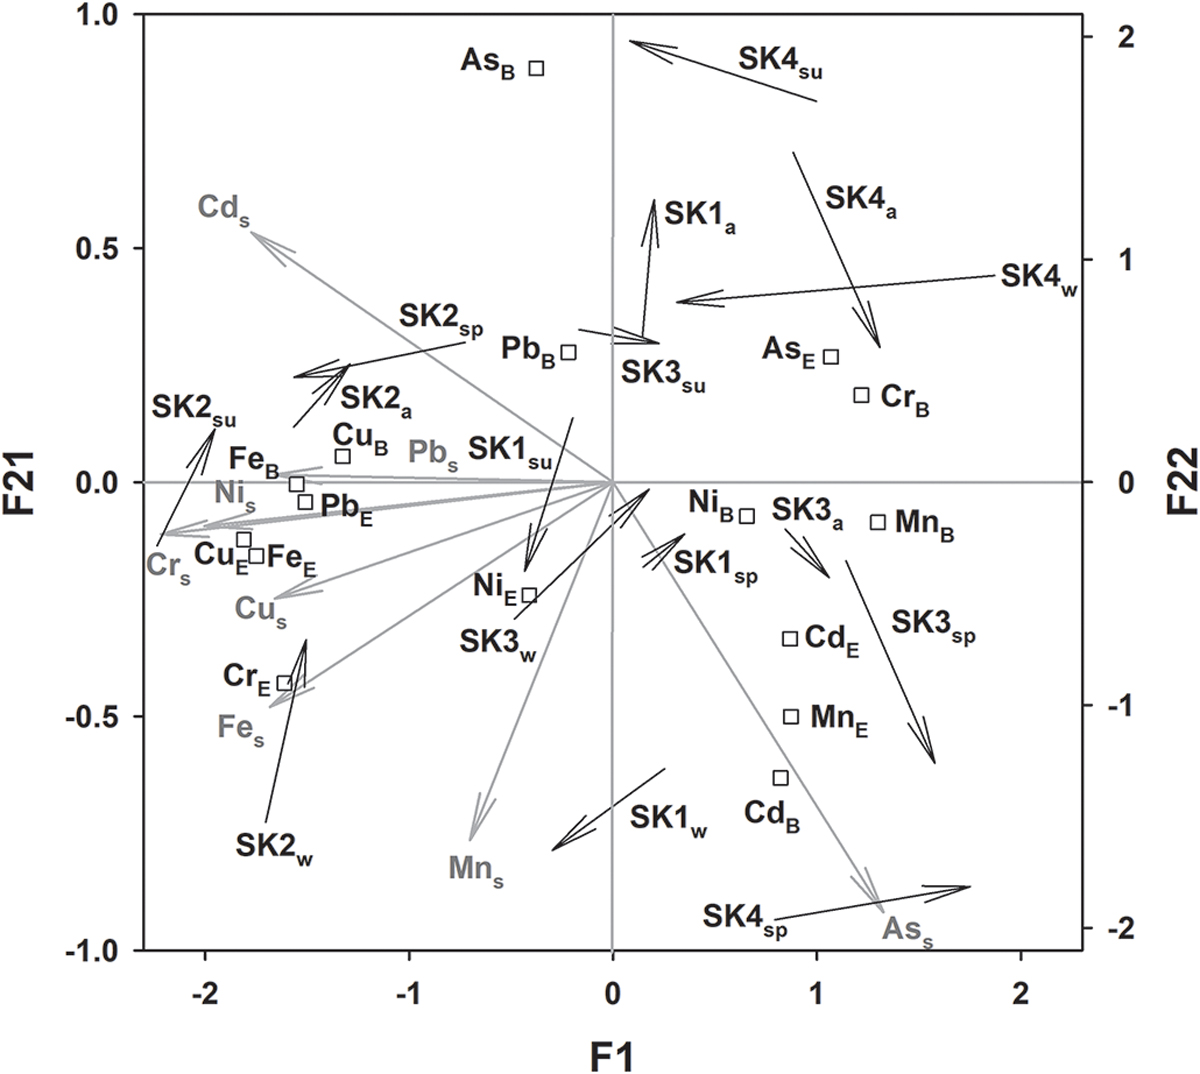
Triplot presentation of the co-inertia analysis (CIA) of eight metal concentrations in the sediment and E. danica and their biota sediment accumulation factor performed on 16 samples [four sites, SK1-SK4, sampled in spring (sp), summer (su), autumn (a), and winter (w)]. The ordination diagram of eight normalized metal concentrations in the sediment (Ass, Cds, Crs,Cus, Fes, Mns, Nis, and Pbs) in the CIA is represented by grey arrows projected onto the F1 × F21 factorial map. Positions of metal concentrations in E. danica (AsE, CdE, Crs,CuE, FeE, MnE, NiE, and PbE) and their BSAF (AsB, CdB, CrB,CuB, FeB, MnB, NiB, and PbB) are also plotted onto the CIA F1 × F21 plane. Standardized co-inertia scores of sediment and E. danica data for each sample (black arrows) are projected onto the F1 × F22 factorial map. Origin of the arrow indicate the position of the sample as ordinated by metal concentrations in the sediment, while the arrowhead indicate its position as ordinated by the values of metal concentrations in E. danica and their BSAF.
Current usage metrics show cumulative count of Article Views (full-text article views including HTML views, PDF and ePub downloads, according to the available data) and Abstracts Views on Vision4Press platform.
Data correspond to usage on the plateform after 2015. The current usage metrics is available 48-96 hours after online publication and is updated daily on week days.
Initial download of the metrics may take a while.