Fig. 2
Download original image
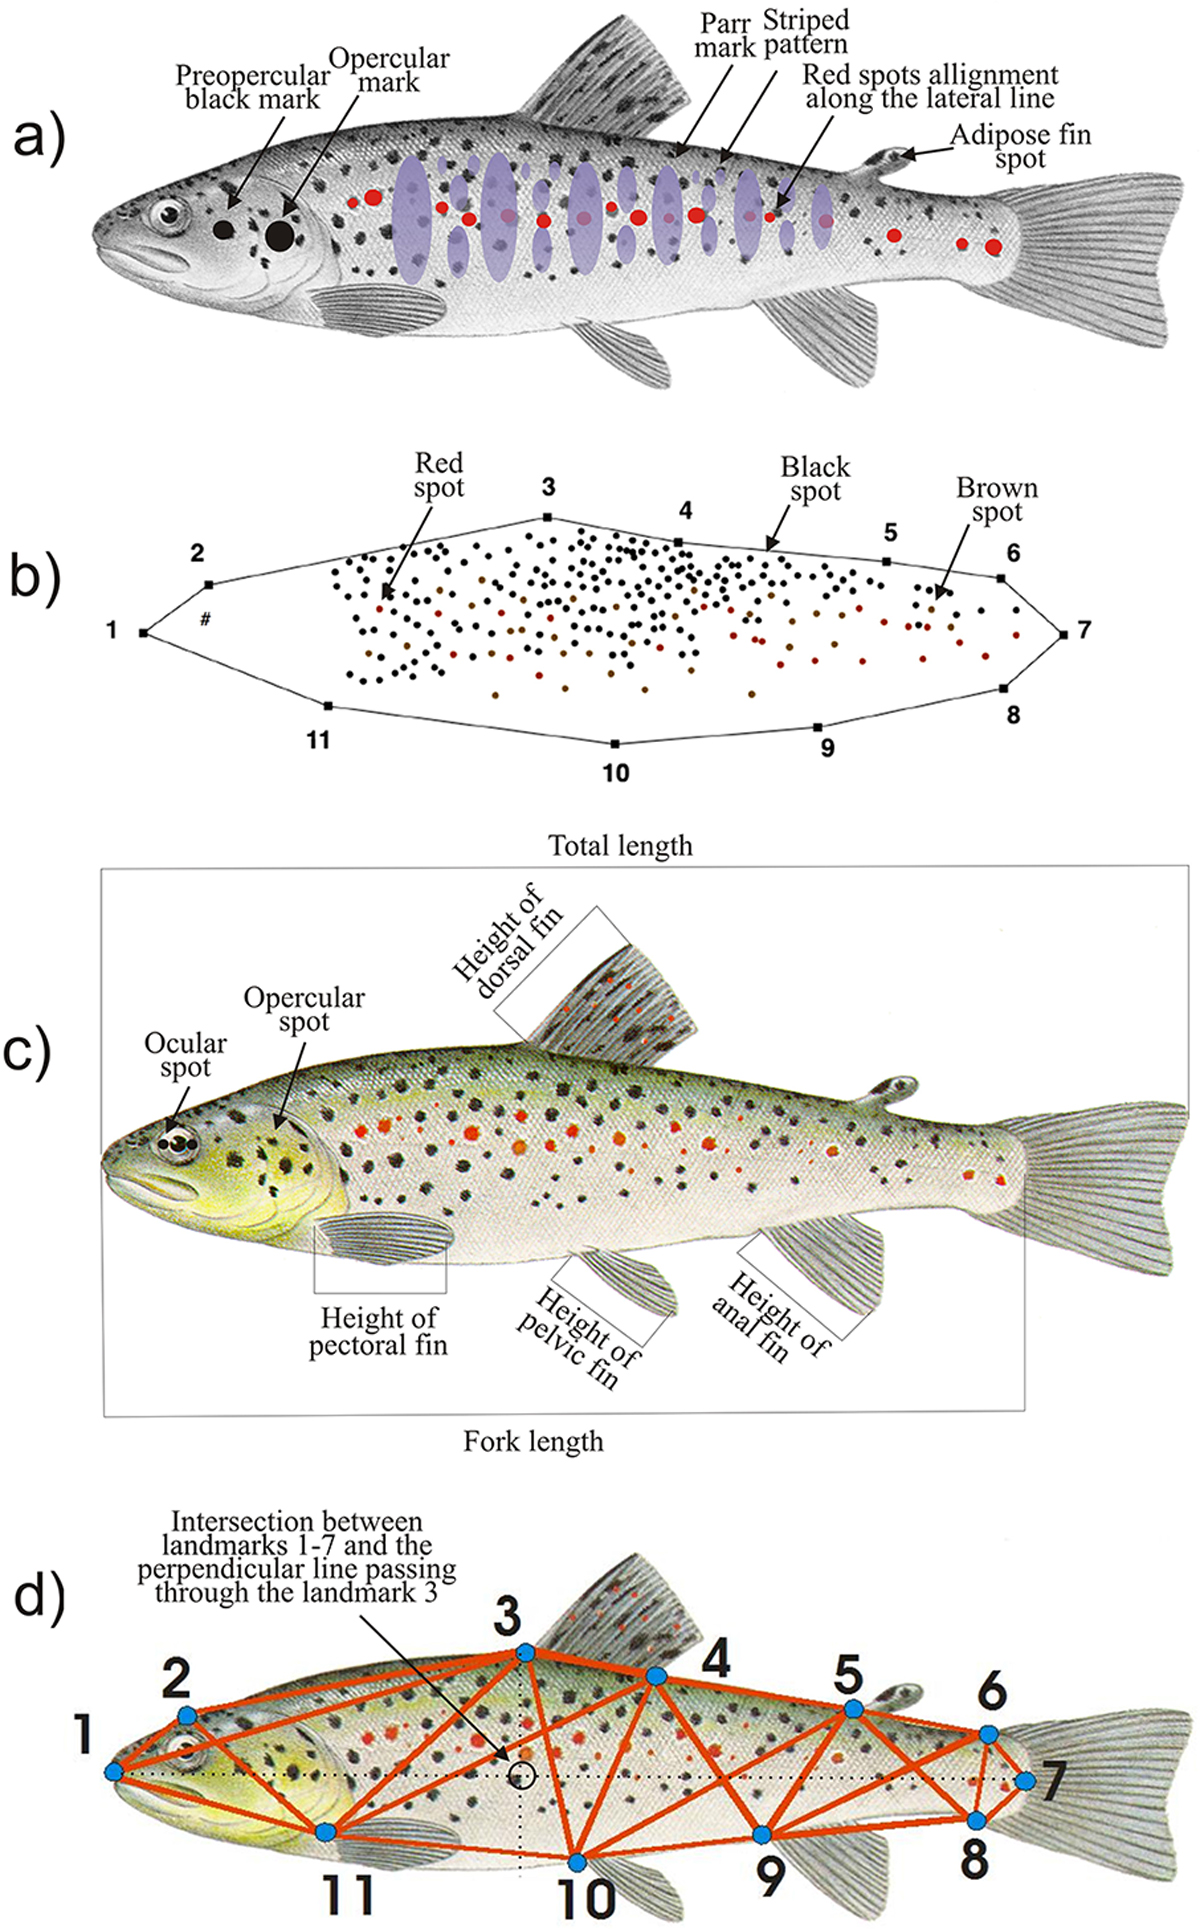
(a) Qualitative variables: presence/absence of parr marks, striped pattern (defined as vertical dark stripes on the body sides of the fish), black mark in the pre-opercular region, black spot on the operculum, alignment of red spots mainly along the lateral line, adipose fin color (brown or white, with or without red, brown and black spots, with or without red margin); brown spots were given by the overlap between black and red spots. (b) Box-truss with localization of brown, red and black spots. (c) Quantitative non-geometric variables: total length, fork length, height of pectoral, anal and pelvic fins, number of red spots on the lateral line, number of ocular and opercular spots, number, frequency (i.e. abundance), intensity (i.e. the ratio between the number of spots and the fish surface) and proportion (i.e. the ratio between the number of spots of a certain color and the total number of spots) of brown, black and red spots on the flank, number, perimeter and area of parr marks. (d) Quantitative geometric variables. Two-dimensional landmarks positions and relative twenty-two distances: (1) anterior tip of the snout at upper jaw; (2) transition point between trunk and snout; (3) anterior insertion of the dorsal fin; (4) posterior insertion of the dorsal fin; (5) anterior insertion of the adipose fin; (6) dorsal insertion of the caudal fin; (7) median insertion of the caudal fin; (8) ventral insertion of the caudal fin; (9) insertion of the anal fin; (10) insertion of the pelvic fin; (11) insertion of the pectoral fin; in addition the following distances were calculated: the distances between the spots centroid and the fish centroid, the distances between the spots centroid and landmark 1, the average distance of brown spots from the intersection between landmark 1–landmark 7 and the perpendicular and the land mark 3 (black circle).
Current usage metrics show cumulative count of Article Views (full-text article views including HTML views, PDF and ePub downloads, according to the available data) and Abstracts Views on Vision4Press platform.
Data correspond to usage on the plateform after 2015. The current usage metrics is available 48-96 hours after online publication and is updated daily on week days.
Initial download of the metrics may take a while.