Fig. 3
Download original image
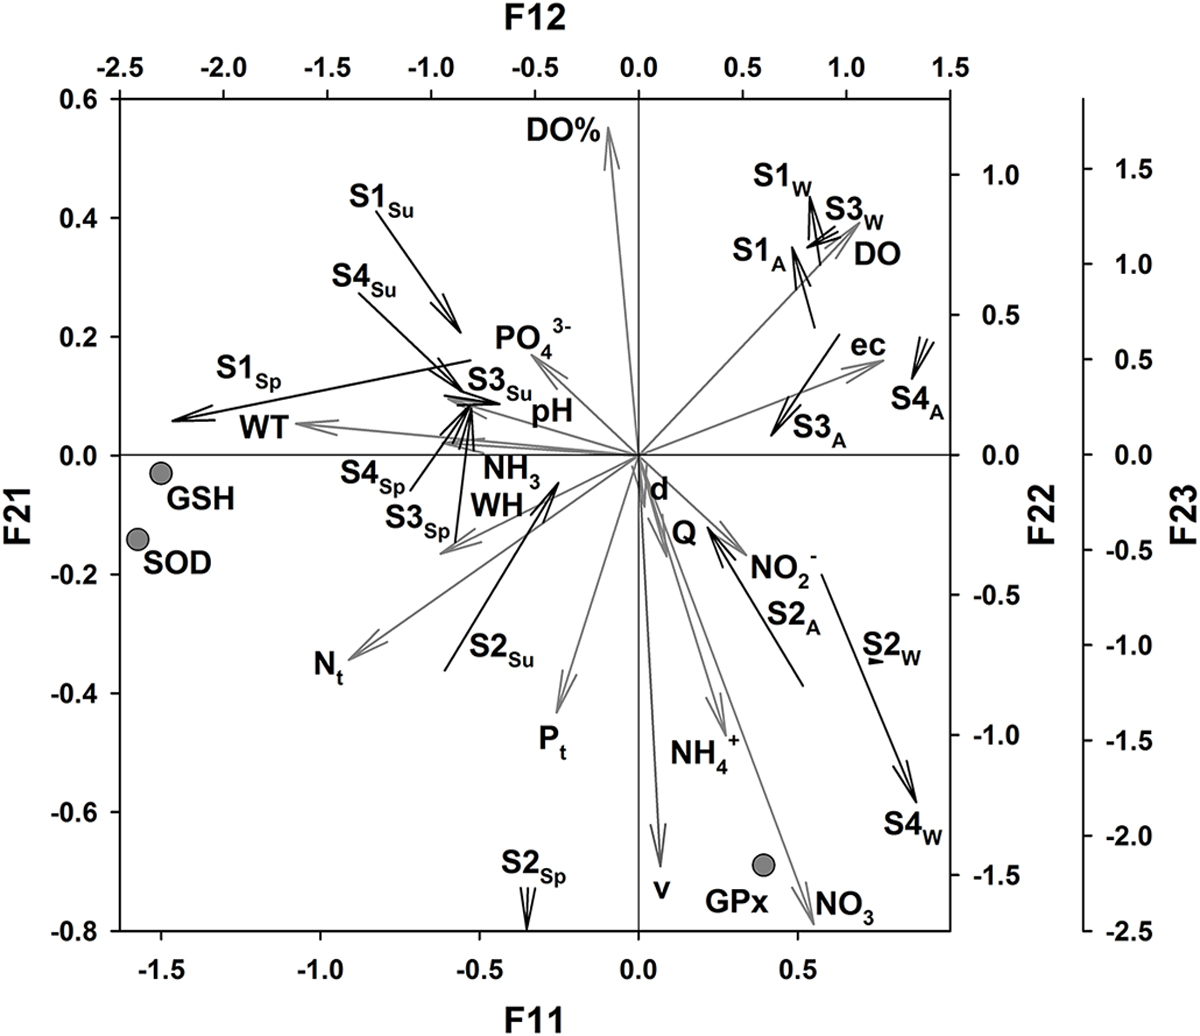
Triplot presentation of the co-inertia analysis (CIA) of 16 environmental variables and three antioxidant biomarkers performed on 16 samples [four sites, SK1-SK4, sampled four times, viz., in spring (Sp), summer (Su), autumn (A), and winter (W)]. The ordination diagram of 15 normalized environmental variables (see Material and Methods section for codes) in the CIA is represented by grey arrows starting from the origin and projected onto the F11 × F21 factorial map. Positions of antioxidant biomarkers (grey circles) are plotted onto the CIA F11 × F22 plane (see Material and Methods section for codes). Standardized co-inertia scores of environmental and antioxidant biomarker data for each sample (black arrows) are projected onto the F12 × F23 factorial map. The arrow origin locates the sample as ordinated by the environmental variables, and the arrowhead locates it as ordinated by values of the antioxidant biomarkers.
Current usage metrics show cumulative count of Article Views (full-text article views including HTML views, PDF and ePub downloads, according to the available data) and Abstracts Views on Vision4Press platform.
Data correspond to usage on the plateform after 2015. The current usage metrics is available 48-96 hours after online publication and is updated daily on week days.
Initial download of the metrics may take a while.