Fig. 5
Download original image
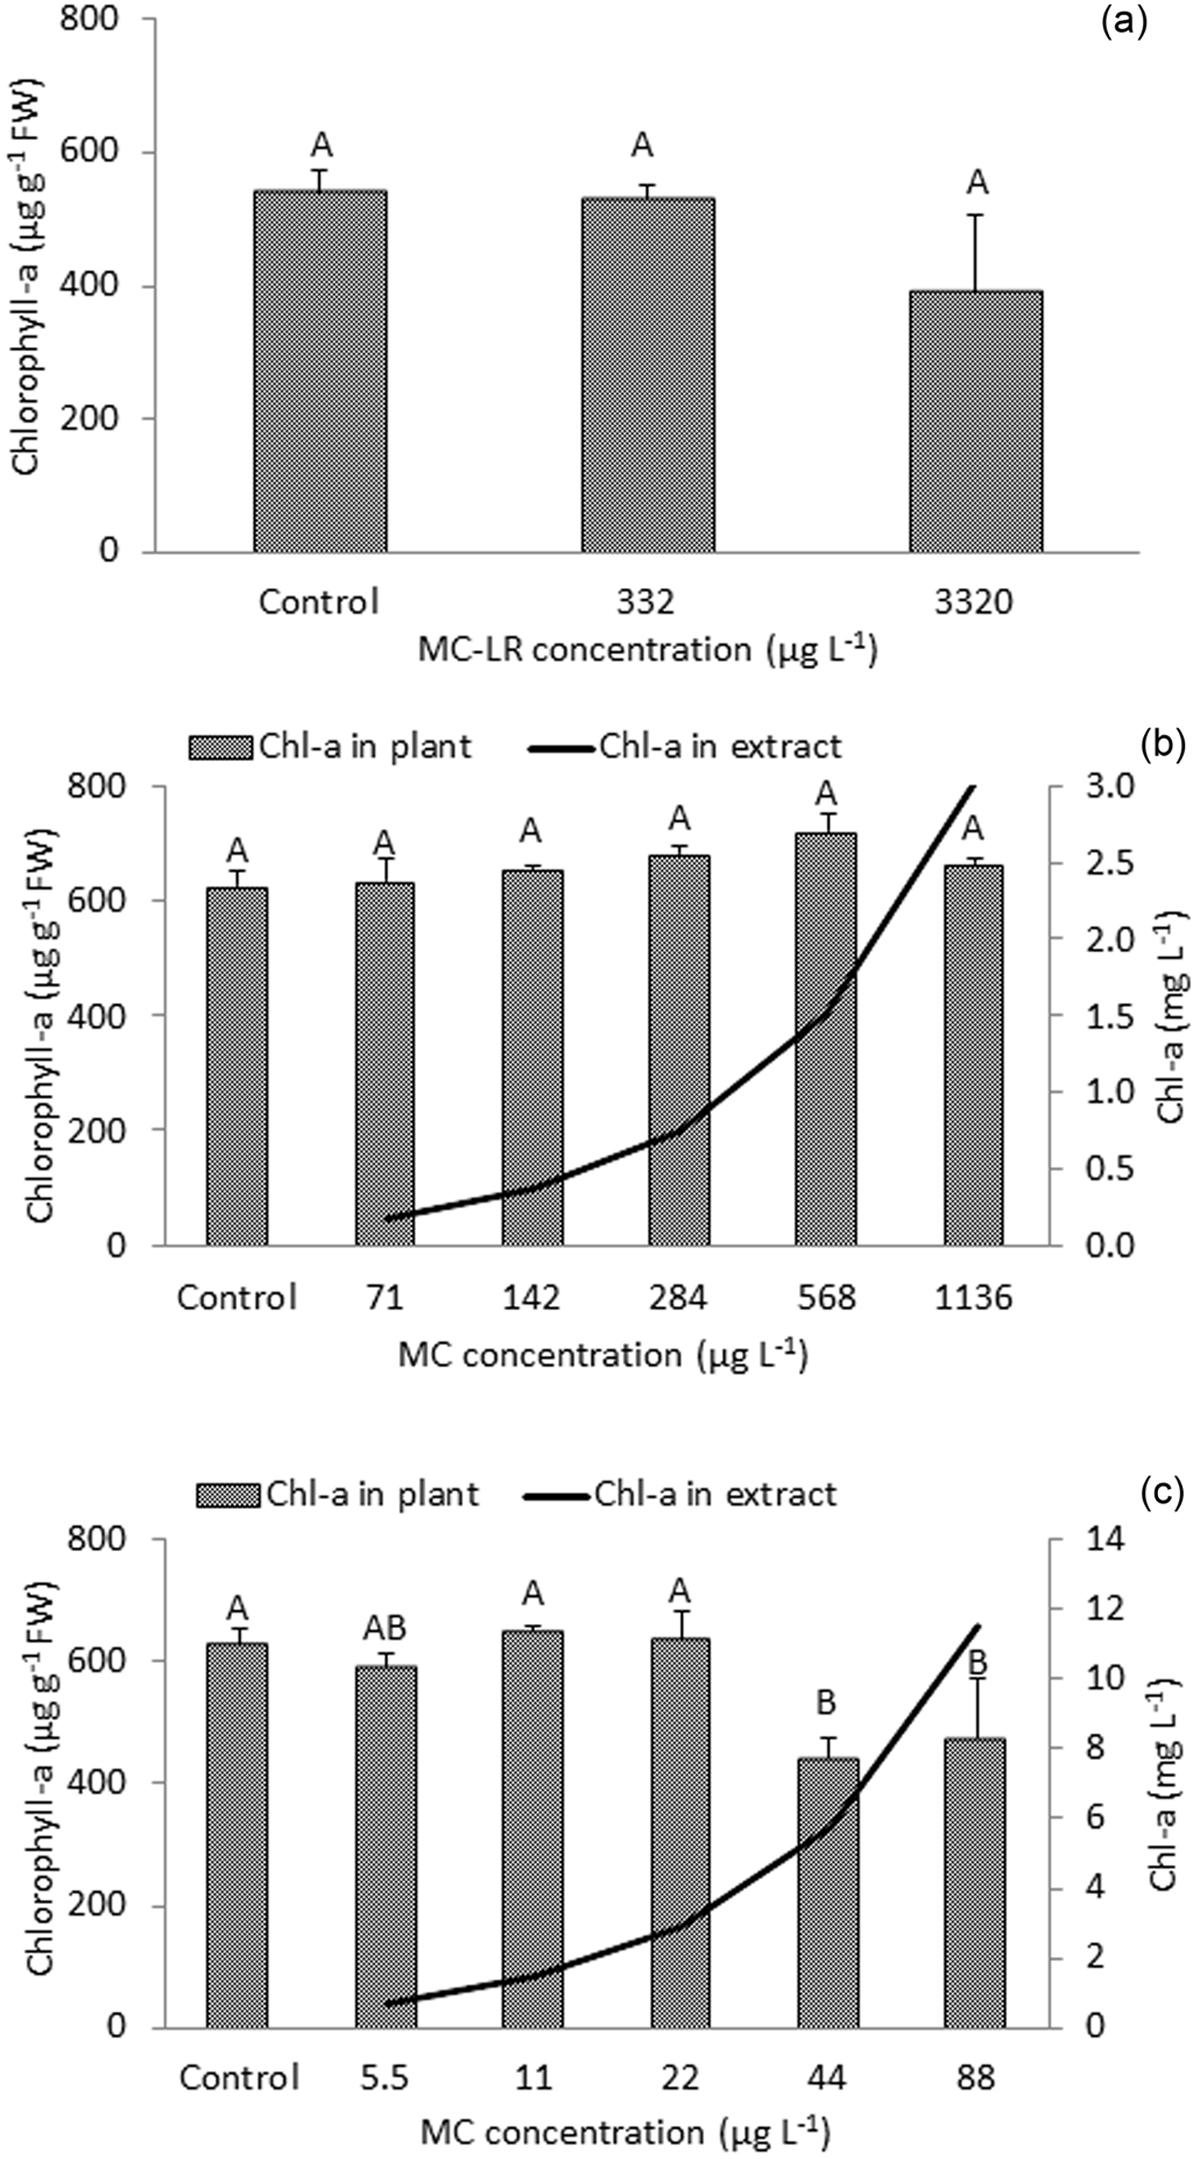
Chlorophyll a content in S. polyrhiza exposed for 96 h to pure MC-LR (a), cyanobacterial extracts Pa-A (b) and Pa-B (c). Data are expressed as means ± SE, n = 5. Different uppercase letters (A, B) indicate statistically significant differences between chlorophyll a content in S. polyrhiza exposed to different concentrations of MC-LR (a); different dilutions of the extracts Pa-A (b) and Pa-B (c) (ANOVA, Tukey's test, p < 0.05).
Current usage metrics show cumulative count of Article Views (full-text article views including HTML views, PDF and ePub downloads, according to the available data) and Abstracts Views on Vision4Press platform.
Data correspond to usage on the plateform after 2015. The current usage metrics is available 48-96 hours after online publication and is updated daily on week days.
Initial download of the metrics may take a while.