Fig. 7
Download original image
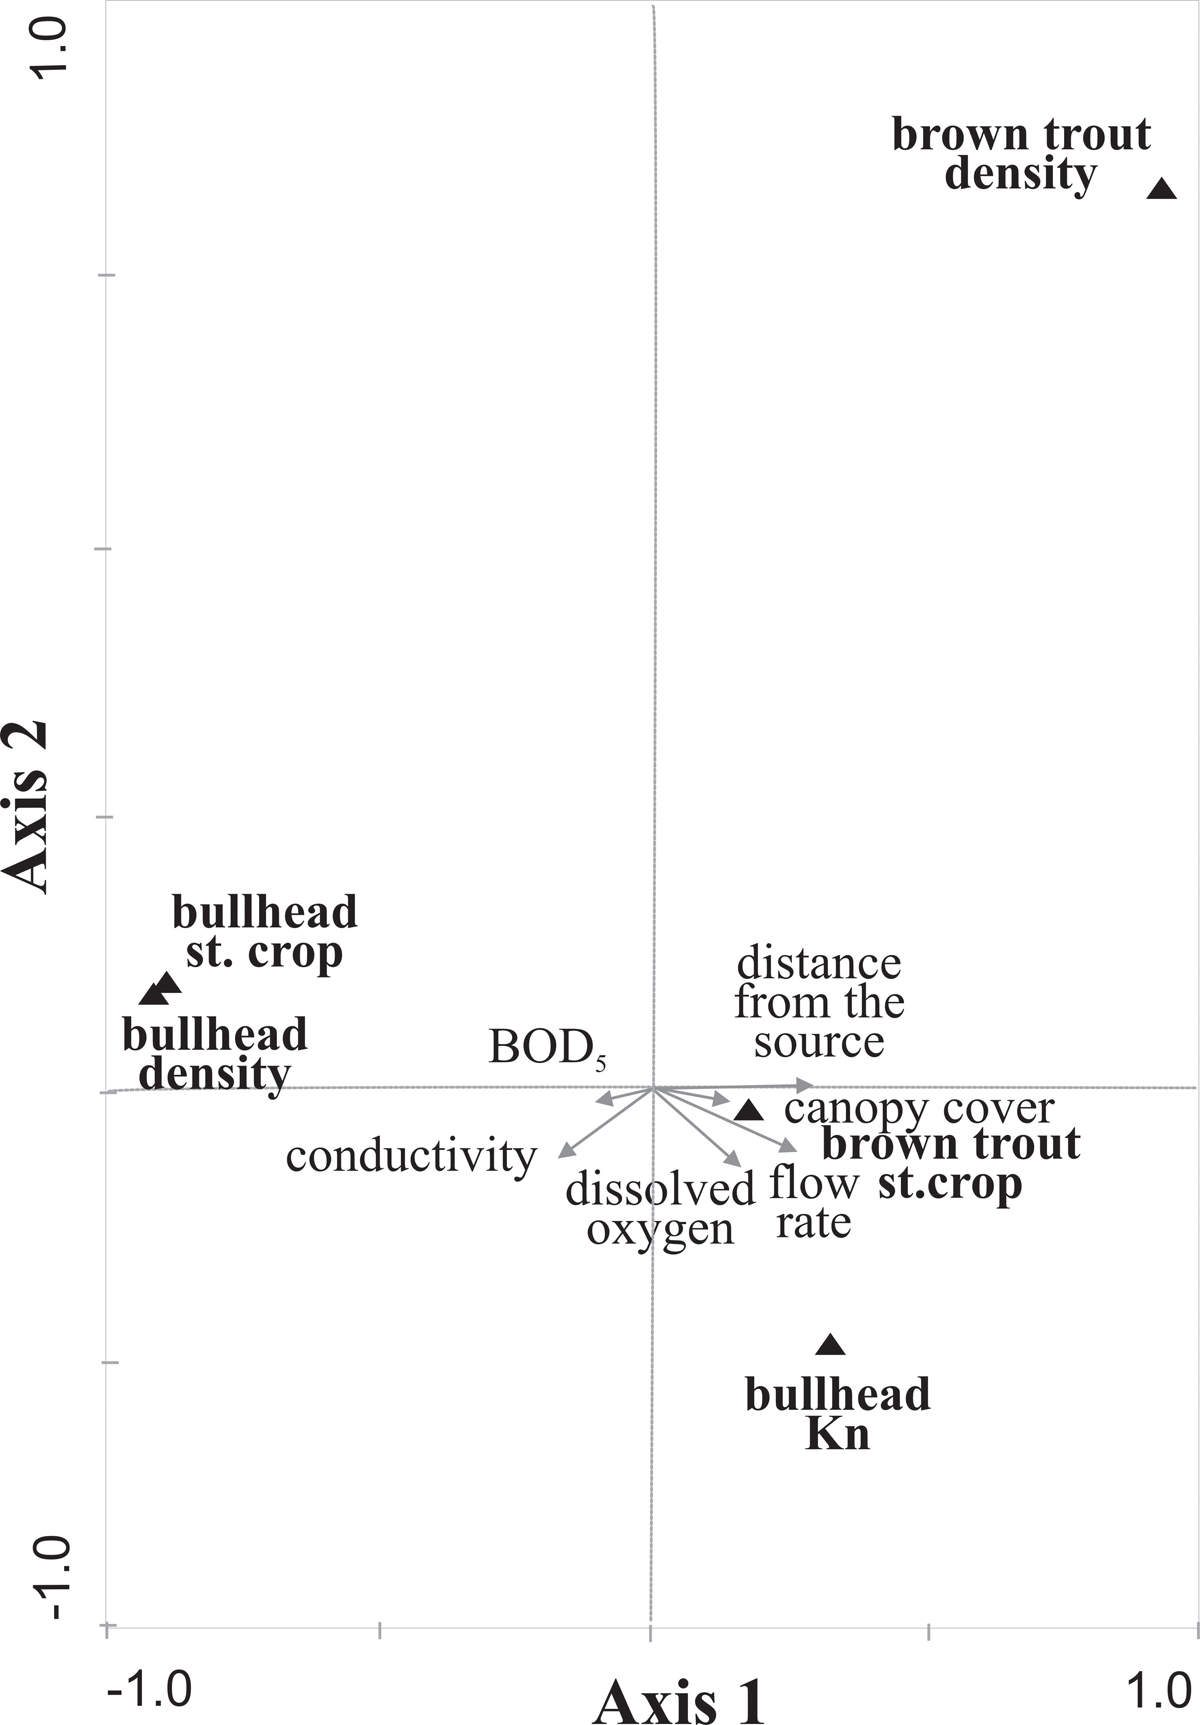
Canonical Correspondence Analysis (CCA): biplot of the environmental matrix showing environmental variables (grey arrows) and of the fish matrix with densities and standing crop of the brown trout, and densities, standing crop, Kn of the bullhead (black triangles). The first two ordination axes explained 93.30% of the total variance. Eigenvalues of axis 1 and 2 were 0.082 and 0.027, respectively. The length of each arrow is proportional to the rate of change and indicates the strength of the correlation with the axes.
Current usage metrics show cumulative count of Article Views (full-text article views including HTML views, PDF and ePub downloads, according to the available data) and Abstracts Views on Vision4Press platform.
Data correspond to usage on the plateform after 2015. The current usage metrics is available 48-96 hours after online publication and is updated daily on week days.
Initial download of the metrics may take a while.