Fig. 2
Download original image
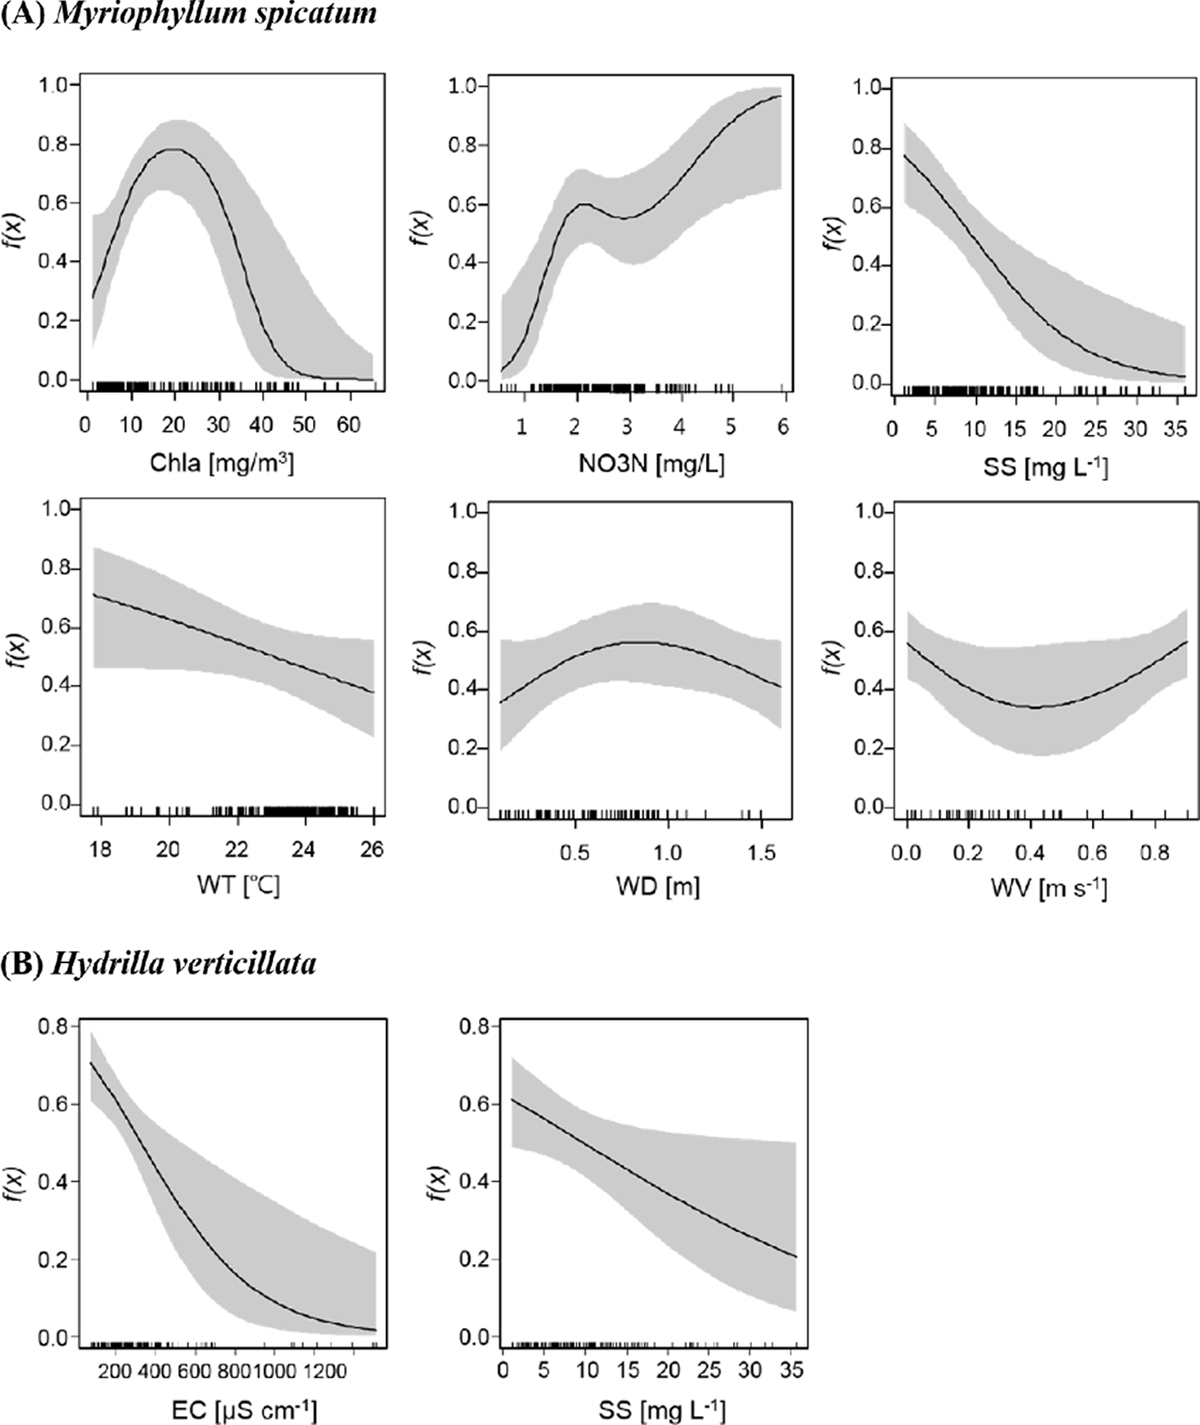
Response curves of (A) Myriophyllum spicatum and (B) Hydrilla verticillata for environmental gradients in GAMs. The vertical axes represent the probabilities of occurrence, and shaded bands show the 95% confidence interval. Rug plots on the x-axis show data points. Chla, chlorophyll a; EC, electrical conductivity; NO3N, nitrate nitrogen; SS, suspended solids; WT, water temperature; WD, water depth; WV, water velocity.
Current usage metrics show cumulative count of Article Views (full-text article views including HTML views, PDF and ePub downloads, according to the available data) and Abstracts Views on Vision4Press platform.
Data correspond to usage on the plateform after 2015. The current usage metrics is available 48-96 hours after online publication and is updated daily on week days.
Initial download of the metrics may take a while.