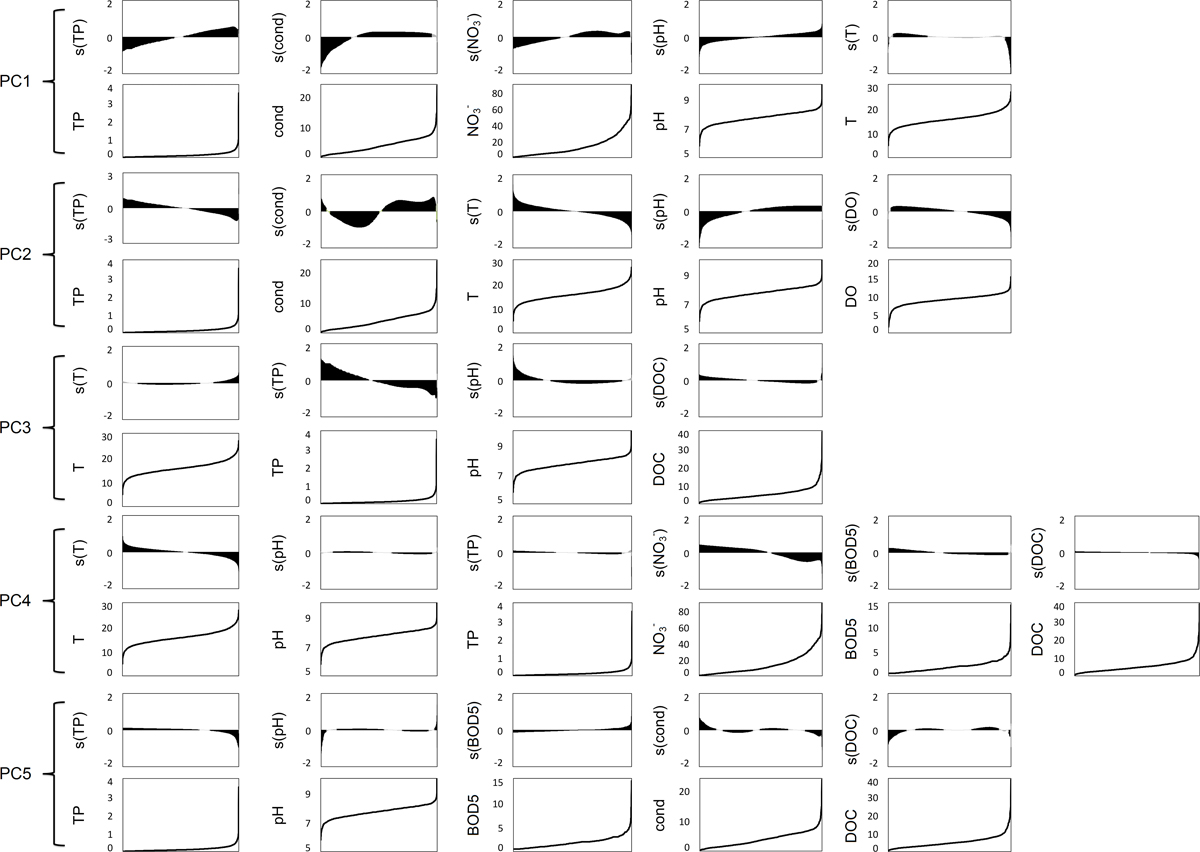
Fig. 3
Download original image
GAMs results. All graphs have in the x-axis the 1571 samples, in ascending order of their values for the involved descriptor. For each PCA axis (PC1 to PC5), the upper lines of the graphs present in the y-axis the contribution − s() − of the descriptors used in the GAM with scores on this PC as response variable. The grey zones represent non-significant samples (i.e. not statistically significantly different from the intercept) and the black zones represent significant samples. Descriptors are presented in descending order (from left to right) of their contribution to the GAMs. For each PC, the lower lines of the graphs present in the y-axis the values taken by the corresponding descriptor (lower graph units: TP in mg L−1; T in °C; NO3− in mg L−1; cond in mS cm−1; BOD5 in mg L−1; DO in mg L−1; DOC in mg L−1). DESCRIPTORS: total phosphorus (TP), conductivity (cond), nitrate (NO3−), pH, temperature (T), dissolved oxygen (DO), dissolved organic carbon (DOC), five-day biological oxygen demand (BOD5).
Current usage metrics show cumulative count of Article Views (full-text article views including HTML views, PDF and ePub downloads, according to the available data) and Abstracts Views on Vision4Press platform.
Data correspond to usage on the plateform after 2015. The current usage metrics is available 48-96 hours after online publication and is updated daily on week days.
Initial download of the metrics may take a while.