| Issue |
Knowl. Manag. Aquat. Ecosyst.
Number 422, 2021
|
|
|---|---|---|
| Article Number | 24 | |
| Number of page(s) | 12 | |
| DOI | https://doi.org/10.1051/kmae/2021024 | |
| Published online | 21 June 2021 | |
Research Paper
Ecological engineering approaches to restoring the aquatic biological community of an urban pond ecosystem and its effects on water quality ‑ a case study of the urban Xixi National Wetland Park in China
Approches d'ingénierie écologique pour restaurer la communauté biologique aquatique d'un écosystème d'étang urbain et ses effets sur la qualité de l'eau − Une étude de cas du parc national des zones humides urbaines de Xixi en Chine
College of Life and Environmental Sciences, Hangzhou Normal University, Hangzhou 311121, PR China
* Corresponding author: This email address is being protected from spambots. You need JavaScript enabled to view it.
Received:
1
February
2021
Accepted:
31
May
2021
Abstract
There is a global increase in urbanization, which contributes to the loss and fragmentation of urban wetland and pond habitats. Urban ponds have an important role in the ecology of urban areas, as they provide essential habitats for aquatic species. The objective of this study is to demonstrate ecological engineering approaches to restoring aquatic biological communities in an urban pond ecosystem, which can be used to achieve water purification of such ecosystems globally. The general approach of first cleaning out the ponds and then systematically applying different treatments of plants and fish was designed and implemented in the field. We used three replicated ponds per engineering treatment to determine which of the treatments was the best option based on an assessment of water quality and biological indicators. The main findings of this study were as follows: a combination of aquatic animals and aquatic plants can provide the best water purification performance; furthermore, macrobenthos, such as Bellamya purificata, can be used as biological indicator species for monitoring dominant species and water quality in a local urban pond ecosystem. In conclusion, maintaining biological species diversity over different trophic levels can provide the best water purification performance in urban pond ecosystems.
Résumé
On constate une augmentation mondiale de l'urbanisation, qui contribue à la perte et à la fragmentation des habitats des zones humides et des étangs urbains. Les étangs urbains jouent un rôle important dans l'écologie des zones urbaines, car ils fournissent des habitats essentiels aux espèces aquatiques. L'objectif de cette étude est de présenter des approches d'ingénierie écologique pour restaurer les communautés biologiques aquatiques dans un écosystème d'étang urbain, qui peuvent être utilisées pour réaliser la purification de l'eau de tels écosystèmes. L'approche générale consistant à nettoyer d'abord les étangs puis à appliquer systématiquement différentes gestions des plantes et des poissons a été conçue et mise en œuvre sur le terrain. Nous avons utilisé un réplicat de trois étangs par traitement technique pour déterminer lequel des traitements était la meilleure option sur la base d'une évaluation de la qualité de l'eau et des indicateurs biologiques. Les principaux résultats de cette étude sont les suivants: une combinaison d'animaux aquatiques et de plantes aquatiques peut fournir la meilleure performance de purification de l'eau; en outre, le macrobenthos, tel que Bellamya purificata, peut être utilisé comme espèce biologique indicatrice pour surveiller les espèces dominantes et la qualité de l'eau dans un écosystème d'étang urbain local. En conclusion, le maintien de la diversité des espèces biologiques à différents niveaux trophiques peut fournir la meilleure performance de purification de l'eau dans les écosystèmes d'étangs urbains.
Key words: Urban ponds / biodiversity / water purification / benthic animals / biological indicators
Mots clés : Étangs urbains / biodiversité / purification de l'eau / animaux benthiques / indicateurs biologiques
© F. Liu and J. Lu, Published by EDP Sciences 2021
 This is an Open Access article distributed under the terms of the Creative Commons Attribution License CC-BY-ND (https://creativecommons.org/licenses/by-nd/4.0/), which permits unrestricted use, distribution, and reproduction in any medium, provided the original work is properly cited. If you remix, transform, or build upon the material, you may not distribute the modified material.
1 Introduction
Globally, there has been a steady increase in the urban population. According to statistical analyses conducted by the Population Division of the Department of Economic and Social Affairs (DESA) of the United Nations, only 30% of the world's population lived in cities in 1950. However, that number had increased to 55% by 2018 and is predicted to rise to 68% by 2050. In addition, the growth of the urban population is particularly significant in developing countries such as India, China, and Nigeria (Population Division of the Department of Economic and Social Affairs of the United Nations, 2014; 2018). It is predicted that by 2030, the total urban area worldwide will increase by 185% and be almost triple that in 2000 (Seto et al., 2012). The process of global urbanization has led to the substantial reduction and fragmentation of natural habitats, which poses a serious threat to global biodiversity. This issue is of grave significance for regions with a high level of biodiversity in developing countries (McDonald et al., 2008). Global urbanization has also resulted in a sharp reduction of urban wetland and urban pond habitats. However, these urban ponds are of great landscape value and, more importantly, play critical roles in the urban ecosystem. Their roles include the protection and maintenance of freshwater biodiversity, urban water storage and flood control, and water treatment and purification (Hassall, 2014; Hill et al., 2017). The definition of a ‘pond’ is subjective and thus varies between researchers. While a wide range of potential definitions exist, ponds are generally defined in terms of their area, being either <2 ha or <5 ha (Biggs et al., 2005; De Meester et al., 2005).
The eutrophication of freshwater is caused by anthropogenic activities that introduce excessive nutrients to freshwater ecosystems. The most common enrichment is the increasing nitrogen and phosphorus content in freshwater, which affects the ecological balance of freshwater ecosystems. The addition of these nutrients has also become one of the top concerns in freshwater ecosystem issues in recent years (Schindler, 2006; Smith and Schindler, 2009; Geist and Hawkins, 2016). Urban wetlands and ponds are subjected to much stronger disturbances from human activities than other freshwater ecosystems because they are geographically located in urban regions. These disturbances have, in turn, induced much more severe eutrophication and pollution in these places (Hassall, 2014; Hill et al., 2017). Therefore, large numbers of polluted freshwater ecosystems have started emerging in cities, primarily owing to a series of chain reactions triggered by eutrophication. These reactions include the degradation of biodiversity, the destruction of the natural aquatic biological community, intensified biological invasion, blooms of certain algae, and the loss of the self-purification ability of freshwater ecosystems in urban wetlands and ponds. Consequently, addressing the water quality issue of urban wetlands and ponds has been a key study area and the focus of many ecological engineering projects centered on ecosystem restoration and urban ecological construction (Geist and Hawkins, 2016).
A considerable number of studies have focused on the removal of nutrients from freshwater ecosystems using artificial wetland technology, whereby nitrogen and phosphorous elements can be eliminated by growing phytoplankton, floating-leaf plants, emerging plants, submerged plants, and a combination of such aquatic plants (Vymazal, 2007; Pedersen et al., 2007; Lu et al., 2008; Zhao et al., 2015). However, the growth rate of aquatic plants varies with different seasons. Specifically, aquatic plants grown in middle- and high-latitude zones tend to grow faster during high summer temperatures. Therefore, they can absorb a large amount of nutrients from freshwater ecosystems and provide excellent water purification performance. During winter, however, most aquatic plants wither; only a small number of them can survive cold weather. In addition, the cold temperatures result in a slow growth rate of these cold-hardy plants; the result is poor water purification performance during winter. For example, a constructed wetland with water hyacinth (Eichhornia crassipes) exhibits excellent water purification performance in summer. However, water hyacinths (Eichhornia crassipes) cannot survive the winter season in northern subtropical regions. Therefore, such a constructed wetland loses its water purification capability completely during the winter season (Lu et al., 2008). Other scholars have also investigated the relationship between the diversity of plants grown in wetlands and the efficiency of nutrient removal. Maintaining greater plant species diversity in wetlands (e.g., a larger number of duckweed species) can stimulate plant growth and improve nutrient removal efficiency (Zhao et al., 2014). Another study reported that using a combination of floating plants (e.g., duckweed) and microbial communities (e.g., denitrifying bacteria) can yield a better nutrient removal performance in wetlands than using only floating plants (duckweed) (Zhao et al., 2015). Furthermore, aquatic animals, as consumers in aquatic ecosystems, also play an important role in the purification of freshwater (Pedersen et al., 2007; Kail et al., 2015; González-Ortegón et al., 2015; McMeans et al., 2015; Eivers et al., 2018). Aquatic animals that can purify sewage include filter-feeding fish, bivalve mollusks, and small zooplankton. For example, Turker et al. (2003) analyzed the performance of different fishes in regard to controlling algal growth in the laboratory. They found that silver carp can effectively control the biomass of cyanobacteria (Turker et al., 2003). Benthic macroinvertebrates are an important biological group in aquatic ecosystems, and they affect the nutrient and energy flow of freshwater ecosystems (Salánki et al., 2003; Ma et al., 2008; González-Ortegón et al., 2015; Boeker et al., 2016). On the one hand, these animal species can regulate the amount of nutrients in freshwater ecosystems by ingesting sediment, plankton, and organic matter resulting from the decay of animals and plants. For example, benthic mollusks can remove organic particles, such as lower algae, through filter feeding. This behavior provides excellent purification performance in relation to chlorophyll and COD in eutrophic freshwater. On the other hand, numerous studies have also shown that aquatic animals are important biological indicators for monitoring water quality in ponds, wetlands, and rivers (Brown et al., 1997; Salánki et al., 2003; Pedersen et al., 2007; Pander and Geist, 2013; Kail et al., 2015; García-Chicote et al., 2018).
In traditional biomanipulation, the population of predacious fishes is increased deliberately in a river to reduce the population of filter-feeding fishes, which feed on plankton. This phenomenon can increase the abundance of large zooplankton in freshwater ecosystems, thus inhibiting the growth of phytoplankton. Nontraditional biomanipulation refers to a biological manipulation model that targets the consumption of cyanobacteria in freshwater ecosystems by (1) reducing the population of predacious fishes and (2) increasing the number of filter-feeding fishes that feed on plankton (Xie and Liu, 2001). Using ecological engineering techniques, we can achieve a variety of objectives, including (1) fully simulating and restoring the trophic level and food web structure in natural wetland and pond ecosystems, (2) releasing an appropriate amount of environmental freshwater flows, and (3) restoring and maintaining high biodiversity in urban wetlands and ponds. These practices can increase biodiversity and improve the function of an aquatic ecosystem, with a particular focus on habitat maintenance, primary production, and water purification. Therefore, these ecological engineering techniques to restore the aquatic biological community of wetlands and ponds are hot topics and directions in the current research field (Hassall, 2014; McMeans et al., 2015; Boeker et al., 2016; Geist and Hawkins, 2016; Yang et al., 2016; Hill et al., 2017; Yao et al., 2017; Olguín et al., 2017).
Urban wetlands and ponds originate from either natural or agricultural (used for production purposes) wetlands and ponds. They are transformed into urban wetlands and ponds owing to urban expansion. The Xixi wetland urban pond explored in this study was historically an agricultural pond, i.e., a mulberry (persimmon)-based fishpond. It was used for and managed by fishery production practices. The pond possesses a well-developed aquatic biological community, a strong self-purification performance, and a high quality of freshwater. The mulberry-based fishpond in China has been listed as one of the Globally Important Agricultural Heritage Systems (GIAHS) by the Food and Agriculture Organization of the United Nations (http://www.fao.org/giahs/background/en/). The Zhejiang Huzhou Mulberry-Dyke & Fishpond System originated more than 2500 years ago and reflects much traditional and agroecological knowledge. It showcases the cultivation of mulberry-dyke trees, silk rearing, and fish cultivation. Furthermore, it is based on a very complex irrigation and drainage system. This system allows many farmers to pursue their needs while protecting a huge biodiversity and a complex landscape (http://www.fao.org/giahs/giahsaroundtheworld/designated-sites/asia-and-the-pacific/huzhou-mulberry-dyke-fish-pond-system/zh/).
The work presented herein is a fundamental application-based study that aims to explore a suitable model for restoring aquatic ecosystems in urban ponds by (1) performing ecological engineering operations (pond dredging), (2) restoring biodiversity in urban ponds using a natural food web structure, (3) establishing an urban pond aquatic ecosystem that enables self-purification of freshwater, and (4) exploring the overall differences among treatments in terms of abiotic and biotic responses. These practices can provide better protection management of urban pond resources and landscapes. Furthermore, they can provide ecological technical support to the restoration management of urban pond ecosystems and water purification. Finally, we expect that this study will provide practical guidance and examples of aquatic biological community restoration and eutrophic freshwater treatment in urban pond ecosystem management around the world.
2 Materials and methods
2.1 Study location
The Xixi urban wetland, with a total area of approximately 11.5 km2, is located at 120.074° E, 30.275° N, in western Hangzhou city, Zhejiang Province, China. The Xixi urban wetland exhibits a subtropical monsoon climate that is characterized by mild temperatures, four distinct seasons, and abundant rainfall. The average annual temperature and precipitation are approximately 16.2 °C and 1400 mm, respectively. The frost-free period lasts for approximately 240 days. The coldest and hottest weather events are found in January and July, respectively. The vegetation and terrain of the Xixi urban wetland are mainly characterized by herbaceous plants and low wetlands, respectively. Owing to these features and the crisscrossing rivers in the local region, the Xixi urban wetland is primarily made up of fishponds, as well as some scattered rivers, lakes, and marshes. The ecological restoration and protection project of the Xixi urban wetland was initiated in 2003. In 2005, the first National Wetland Park in China was established in the Xixi urban wetland. A series of ecological restoration measures were also adopted at the same time, including the establishment of a reserve, restoration of the vegetation, and restoration of the freshwater ecosystems. In 2009, the Xixi urban wetland was included in the List of Wetlands of International Importance. It is also the first and only National Wetland Park in China that integrates urban wetlands, agricultural wetlands, and cultural wetlands into a single entity. Urban ponds constitute the most important component of the Xixi urban wetland, of which there are a total of 1159 in the urban Xixi National Wetland Park. Therefore, the protection and restoration of urban pond ecosystems is an important task under the ecological protection of Xixi urban wetlands. In this study, 12 urban ponds were selected as the samples. The spatial distribution of these ponds is captured by the remote sensing image shown in Figure 1.
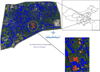 |
Fig. 1 The remote-sensing image showing the spatial distribution of the testing urban ponds of Xixi Wetland. |
2.2 Experimental design
A combination of two aquatic plants and six freshwater fish was used in different test ponds. Four test groups were established in our study. While three of test groups were restoration groups that contained biomes with different combinations of organisms, the fourth was a blank control group, i.e., an urban pond under natural conditions. Three repeated tests were performed for each group, and a total of 12 urban ponds were used in our tests. The urban ponds tested in each group were located close to each other and had the same initial conditions. Before the actual tests were performed, the ponds used in the three treatment groups were cleaned and dredged. The average sludge thickness and water depth before dredging were 0.60 m and 1.36 m, respectively; these numbers changed to 0.05 m and 2.00 m after dredging, respectively. An initial native environmental condition was provided for the growth of aquatic organisms after the dredging process.
The detailed ratios of aquatic plants and fish distributed in each group are shown in Table 1.
The detailed combinations of organisms in each treatment group are shown below:
Treatment group 1: pond dredging + four major Chinese carp species (black carp (Mylopharyngodon piceus), grass carp (Ctenopharyngodon idellus), silver carp (Hypophthalmichthys molitrix), bighead carp (Aristichthys nobilis)) + crucian carp (Carassius auratus).
Treatment group 2: pond dredging + four major Chinese carp species (black carp (Mylopharyngodon piceus), grass carp (Ctenopharyngodon idellus), silver carp (Hypophthalmichthys molitrix), bighead carp (Aristichthys nobilis)) + aquatic plants (Myriophyllum aquaticum and Hydrocotyle vulgaris).
Treatment group 3: pond dredging + four major Chinese carp species (black carp (Mylopharyngodon piceus), grass carp (Ctenopharyngodon idellus), silver carp (Hypophthalmichthys molitrix), bighead carp (Aristichthys nobilis)) + crucian carp (Carassius auratus) + topmouth culter (Erythroculter ilishaeformis).
Control group: no pond dredging, no plants, no fish.
The hierarchical structure of aquatic plants and aquatic animals (fish) in the experimental design is shown in Figure S1 (in the Supplementary Material). Aquatic grasses are distributed in the uppermost layer of freshwater (surface of freshwater) as a floating island of plants. Different species of fishes are distributed at different water levels based on their living habits and food sources. The planar spatial distribution of the floating island of aquatic plants is shown in Figure S2 (in the Supplementary Material).
Flora and fauna weight per area of each treatment group.
2.3 Testing and sampling
The dredging of the treatment urban ponds was finished at the end of 2013. The fish were raised in a free ambient environment in the first half of 2014. A preliminary experimental planting of the aquatic plants was performed in the second half. The actual planting of the aquatic plants was accomplished at the end of August 2015. The freshwater quality was monitored starting in September 2015, and water samples were collected in the middle of each month. The analysis of the water quality lasted for one year, during which time a total of 12 sample collections were performed. During each sampling, a 1-L water sample was collected in a sampling bottle from each of the 12 urban ponds for indoor analysis. The sampling locations were evenly distributed in the available sampling areas in the sample urban ponds. Samples were collected periodically from fixed sampling locations. Since aquatic plants grow quite slowly, the sampling of the plants was performed in different seasons based on the planting time and growing season. Specifically, the aquatic plants were sampled in September (the month when they were planted), January (winter), May (spring), and July (summer). These plant samples were used as an indicator for monitoring their growth trend. The sampling of the zoobenthos was performed using a Peterson grab sampler with a total volume of 1/16 m2. The samples were collected three times at each sampling point and then merged into a single sample. This practice was repeated three times for each testing area. After collecting the samples on site, they were then stored in a freezer and brought back indoors, where a 0.50-mm sieve was subsequently used to screen the sediment. After filtering out the large impurities, the mud samples were washed and poured into the anatomical tray, where all the zoobenthos were carefully picked out. These zoobenthos were then stored in a 10% formaldehyde solution and properly labeled before identification, counting, and weighing were performed. The species of these samples were identified by observing them under a stereomicroscope. The weights of these samples were measured using a one-thousandth electronic balance after the water at their surface was removed with filtering paper. Finally, the number of individuals and weight of each sample were converted to density per unit area (ind/m2) and wet weight biomass (g/m2).
2.4 Water quality measurement and chemical analysis
The main indicators and methods used for measuring the water quality are listed as follows:
Physical indicator: Transparency, measured using a Secchi Disc;
Chemical indicator: Dissolved oxygen (DO), measured using a Hach HQ30D portable dissolved oxygen meter;
Total nitrogen (TN) was measured using an alkaline potassium persulfate digestion UV spectrophotometric method (HJ 636-2012);
Total phosphorus (TP) was measured using the ammonium molybdate spectrophotometric method (GB11893-89); and Chemical oxygen demand (CODMn) was measured using the acidic potassium permanganate salt index method (GB 11892-89).
2.5 Data analysis and statistics
The statistical analysis of the data was performed using SPSS 19.0 statistical software, the graphics were generated using Origin 9.0, and the variance was analyzed using the one-way variance analysis method with multiple comparisons. Cluster analysis was applied to test the overall differences among treatments in terms of abiotic and biotic responses.
The removal rate was calculated using the following equation: removal rate = the concentration of the control group measured at the sampling moment ‑ the concentration of the treatment group measured at the sampling moment/the concentration of the control group measured at the sampling moment × 100%.
3 Results and discussion
3.1 The overall differences among treatments in terms of abiotic and biotic responses
The abiotic factors in this study were transparency, DO, TN, TP and CODMn, and the biotic factors were 29 species of macrobenthos (see Tab. 2). The shortest distance method of Euclidean distance was applied to cluster the four groups of treatments. The trees of the system cluster are shown in Figure 2, and the Euclidean distance matrices are shown in Tables S1 and S2 (in the Supplementary Material). Treatment group 1 was combined with treatment group 2 into a small class, which was then merged with treatment group 3 into a large class; these three treatment groups composed the last class, along with the control group (see Fig. 2a). The difference between the treatment groups and the control group was relatively large. Compared with the four groups of macrobenthos, treatment group 1 and treatment group 2 were similar; they were composed of a small class, which was then combined with the control group to form a large class (see Fig. 2b). Finally, the last class was formed with treatment group 3. The differences among treatment group 3 and the other two treatment groups were relatively large, and treatment group 3 was more similar to the control group. The overall responses of abiotic and biotic indicators to the four treatments were still different, but the overall trend was consistent. Treatment group 2, which had better water quality, was significantly different from the control group in terms of both abiotic and biotic responses.
Distribution and dominance of macrobenthic fauna in Xixi wetland experimental ponds.
 |
Fig. 2 The trees of system cluster among treatments in terms of abiotic (a) and biotic (b) indicators. |
3.2 Comparing the effects of the three different treatments on water purification in urban ponds
3.2.1 The effects of the three different treatments on the transparency of freshwater in urban ponds
Multiple comparison analysis was performed on the transparency data of water samples subjected to different treatments and collected 12 different times. The data was expressed as the mean ± standard error. The statistical results are shown in Figure 3.
As shown in the figure, the transparency of treatment group 2 was substantially higher than that of the control group and treatment group 3. Treatment group 2 also differed significantly from the control group (P = 0.028 < 0.050). Similarly, there was a significant difference between treatment group 2 and treatment group 3 (P = 0.049 < 0.050). However, the difference between treatment group 2 and treatment group 1 was not significant (P = 0.233 > 0.050). Nevertheless, the average transparency value of treatment group 2 was still higher than that of treatment group 1. These results suggest that aquatic plants played an important role in improving the transparency of freshwater. On the one hand, these plants could reduce the content of suspensions in freshwater. On the other hand, the four major Chinese carp species could effectively control the quantity of phytoplankton, which reduced turbidity and increased the transparency of the freshwater. Therefore, the lighting conditions intensified in the freshwater, which benefited not only the photosynthetic process of Myriophyllum aquaticum and Hydrocotyle vulgaris on the floating island of aquatic plants but also the growth of plankton in the freshwater and the healthy functioning of the aquatic ecosystems. The results from this test demonstrated that growing aquatic plants had a significant effect on the transparency of fishponds in urban areas.
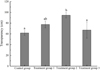 |
Fig. 3 The average transparency value and the statistical results of the different treatment groups. |
3.2.2 The effects of the three different treatments on the DO of freshwater in urban ponds
Multiple comparison analysis was performed on the DO data of water samples subjected to different treatments and collected at 12 different times. The data was expressed as the mean ± standard error. The statistical results are shown in Figure 4.
The analysis presented in Figure 4 shows that the average DO values of the treatment groups were generally higher than those of the control group. In particular, the difference in DO content between treatment group 3 and the control group was highly significant (P = 0.007 < 0.010). This finding suggested that stocking the pond with the carnivorous topmouth culter could increase the DO content of the freshwater. In addition, there was also a significant difference between treatment group 1 and treatment group 3 (P = 0.022 < 0.050). This result further indicated that the habit of disturbing the water layer during the feeding process by the topmouth culter could substantially affect the DO content in freshwater. This behavior played an important role in the complete food chain composed of consumers + producers. The DO contents of the freshwater in treatment group 1 and treatment group 2 exceeded that in the control group by 0.42 mg/L and 1.10 mg/L, respectively. This difference was insignificant (P = 0.270 > 0.050), which might be attributed to the pond area and biological activity of treatment groups 1 and 2. However, to some extent, the treatment approaches taken in these two groups determined the increase in the DO content of the freshwater. In general, treatment group 3 exhibited the best performance in terms of increasing the DO content of freshwater.
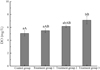 |
Fig. 4 The average DO value and the statistical results of the different treatment groups. |
3.2.3 The effects of the three different treatments on the performance of TN removal from freshwater in urban ponds
Multiple comparison analysis was performed on the TN data of water samples subjected to different treatments and collected at 12 different times. The data was expressed as the mean ± standard error. The statistical results are shown in Figure 5.
As shown in Figure 5, the average content of TN in treatment group 2 was significantly different from those in the control group and treatment group 1 (P = 0.037 and 0.039 < 0.050, respectively). The average TN value of treatment group 2 was 0.35 mg/L and 0.11 mg/L less than those of treatment groups 1 and 3, respectively; thus, the removal effect of TN in treatment group 2 was more significant. In addition to the effects of the combination of four major Chinese carp species, the aquatic plants grown in treatment group 2 (i.e., Myriophyllum aquaticum and Hydrocotyle vulgaris) exhibited a strong TN-absorption capability. Nitrogen existed mainly in the form of ammonia nitrogen, nitrate nitrogen, nitrite nitrogen, and organic nitrogen in the freshwater. Aquatic plants can absorb ammonia nitrogen and convert part of it into organic nitrogen. At the same time, the microbes in freshwater could also release a portion of nitrogen into the air through the processes of nitrification and denitrification.
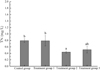 |
Fig. 5 The average TN value and the statistical results of the different treatment groups. |
3.2.4 The effects of the three different treatments on TP removal from freshwater in urban ponds
Multiple comparison analysis was performed on the TP data of water samples subjected to different treatments and collected at 12 different times. The data was expressed as the mean ± standard error. The statistical results are shown in Figure 6.
As shown in Figures 5 and 6, the change in TP content between the different treatment groups followed a similar trend with that in TN content, where a significant difference was found between treatment group 2 and the control group, as well as treatment group 2 and treatment group 1 (P = 0.022 and 0.046 < 0.050, respectively). In addition, the average TP value of treatment group 2 was 0.01 mg/L less than that of treatment group 3. This finding indicated that treatment group 2 exhibited the best TP removal performance in freshwater. In autumn, the aquatic plants could absorb large amounts of soluble phosphorus in freshwater during the adaptive growth period, while at the same time, the reduced biological activity of fish resulted in reduced disturbance to the sediment substances. Therefore, the phosphorous content was reduced in the freshwater.
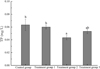 |
Fig. 6 The average TP value and the statistical results of the different treatment groups. |
3.2.5 The effects of the three different treatments on the performance of COD removal from freshwater in urban ponds
Multiple comparison analysis was performed on the CODMn data of water samples subjected to different treatments and collected at 12 different times. The data was expressed as the mean ± standard error. The statistical results are shown in Figure 7.
By analyzing the trend of the change in CODMn from Figure 7, it was found that the average CODMn of treatment groups 1 and 2 was significantly different from that of the control group (P = 0.024 and 0.041 < 0.050, respectively), and there was no significant difference between treatment group 3 and the control group (P = 0.306 > 0.050). In treatment group 2, the utilization and adsorption of organic matter by the aquatic plants created a particular microbial environment that affected the organic matter in the freshwater. The better CODMn removal performance found in the filter-feeding fish-based treatment of group 1 was possibly due to the different microbial environments formed by the fish stocking environment. Such a microbial environment yields different conditions necessary for the decomposition of organic matter. In addition, the better CODMn removal performance might also be related to the selective feeding activity of the fishes in the urban pond ecosystem.
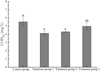 |
Fig. 7 The average CODMn value and the statistical results of the different treatment groups. |
3.2.6 A comprehensive evaluation of the water purification performance in urban ponds based on the three different treatments
Through the one-year monitoring of the purification performance in eutrophic freshwater using different treatment approaches, it was found that the effect on the physical and chemical indicators of the freshwater could differ for different treatment combinations. For example, treatment group 2 had the best performance in terms of transparency, a physical indicator, as well as nitrogen and phosphorus removal, which were chemical indicators. Treatment group 1 had the best performance in terms of CODMn removal in freshwater, while Treatment group 3 had the best performance in terms of DO content. However, from a multifactor perspective, treatment group 2 exhibited the best water purification performance, especially in relation to the nitrogen and phosphorous removal performance for the urban pond ecosystem.
Many studies have shown that aquatic plants exhibit excellent performance at removing nitrogen and phosphorous from freshwater (Granéli and Solander, 1988; Clarke and Wharton, 2001). Therefore, maintaining a diverse range of aquatic plants could play an important role in restoring the self-purification capability of aquatic ecosystems. In particular, a combination of high aquatic animal diversity (fish diversity) and high aquatic plant diversity could yield the best water purification performance (Chen et al., 2016) and improve the water quality by one level (e.g., from Grade III to Grade II water quality). The two types of floating island plants selected in our study (Myriophyllum aquaticum and Hydrocotyle vulgaris) were both resistant to cold temperatures. They also shared a similar trend in growth rate, which first increased and then decreased, starting from the autumn season. The biomass statistics of these two plants are summarized in Figure S3 (in the Supplementary Material). The largest biomass was found in the winter season for both plants. Specifically, the fresh weights of Myriophyllum aquaticum and Hydrocotyle vulgaris were 7950 g/m2 and 4925 g/m2, which increased by 91.6% and 41.7%, respectively, compared to those measured in autumn. Myriophyllum aquaticum was found to grow even faster than Hydrocotyle vulgaris. Species or assemblages that convey biogenic structures or act as ecosystem engineers and keystone species should be given priority (Geist and Hawkins, 2016).
3.3 The diversity of macrozoobenthos
3.3.1 The composition of macrozoobenthos and the dominant species
In this study, a total of 29 macrozoobenthos species were collected in the testing region in the Xixi wetland. These macrozoobenthos belonged to 3 courses, 6 classes, and 16 subjects. Among them, mollusks occupied the highest fraction—31.0% of the total species—followed by annelids, with 7 species that accounted for 24.1% of the total species. In addition, there were 6 species of chironomid larvae and 7 species of arthropods, accounting for 20.7% and 24.1% of the total species, respectively (as shown in Tab. 2).
From the perspective of the dominance index (Y), it was found that the most dominant species in the sampling region was Bellamya purificata (Y = 0.109), followed by Branchiura sowerbyi (Y = 0.071), Limnodrilus hoffmeisteri (Y = 0.060), Chironomus plumosus (Y = 0.052), Einfeldia dissidens (Y = 0.042), and Parafossarulus eximius (Y = 0.041). Due to the different aquatic ecosystems associated with each treatment group, the distribution of zoobenthos also varied between different treatment groups. For example, Bellamya purificata accounted for 33.9%, 36.9%, 24.6%, and 3.9% of the total macrozoobenthos in the control group, treatment group 3, treatment group 1, and treatment group 2, respectively. Branchiura sowerbyi and Limnodrilus hoffmeisteri, each accounting for 54.6% and 70.8% of the total macrozoobenthos, had the highest density and percentage among all the species in the control group. However, neither of these species were found in treatment group 2. On the other hand, trilobiformes of Oligochaeta have often been used as an indicator of high stain resistance due to water eutrophication (Wang and Liang, 2001). Thus, this outcome indicated that the water pollution in the control group was very severe. Lastly, we found that the density of Chironomus plumosus was greater than 50.00 ind/m2 in both treatment groups 1 and 3; the density of Einfeldia dissidens was greater than 50.00 ind/m2 in treatment group 3 and lower than 50.00 ind/m2 in treatment group 1. Considering that chironomids are known to exhibit high resistance to dirt, the previous results suggested that the water quality of treatment groups 1 and 3 was worse than that of treatment group 2.
3.3.2 Density and biomass of macrobenthos
The average density of macrobenthos measured in the testing area was 67.51 ind/m2 (as shown in Figure S4 in the Supplementary Material). Among all groups, annelids possessed the most advantageous density, accounting for 33.3% of the total density. This was followed by chironomid larvae, whose density was 31.4% of the total density. Annelid had the highest density of 181.33 ind/m2 in the control group, while mollusk and chironomid larvae had the highest densities of 103.11 ind/m2 and 208.00 ind/m2, respectively, in treatment group 3. In treatment group 2, mollusks had the highest density of 14.22 ind/m2, while the density of annelids was only 1.78 ind/m2. In addition, the total density of zoobenthos was significantly smaller in treatment group 2 than in the other groups. The average density of oligochaetes followed this order: control group > treatment group 1 > treatment group 3 > treatment group 2. The average densities of oligochaetes in the control group, treatment group 1, treatment group 2, and treatment group 3 were 36.27 ind/m2, 16.59 ind/m2, 1.78 ind/m2, and 15.41 ind/m2, respectively. Considering that oligochaete species are an important indicator of organic pollution in freshwater, it could be inferred that the water quality of treatment group 2 was much better than that of the other groups.
The average biomass of macrobenthos investigated in the test area was 224.00 g/m2 (as shown in Figure S5 in the Supplementary Material). The data analysis showed that mollusks had the highest biomass among all species, with an average biomass of 65.30 g/m2, accounting for 29.2% of the total average biomass. Annelids had the second highest biomass at 0.97 g/m2, accounting for 0.4% of the total average biomass. Chironomid larvae had the lowest biomass, with an average value of 0.21 g/m2, accounting for 0.1% of the total average biomass. The average biomasses of mollusks measured in the different testing groups were in the following order: treatment group 3 > treatment group 1 > control group > treatment group 2. The corresponding biomasses were 95.31 g/m2, 89.29 g/m2, 65.12 g/m2, and 11.48 g/m2. Furthermore, the density of mollusks was highest in treatment group 3 and lowest in treatment group 2.
Mollusks could be used as sensitive species to indicate the water environment. Studies have shown a significant negative correlation between the species and quantity of mollusks and the nutrient levels of freshwater (Wu et al., 1999; Thomson et al., 2005; Boeker et al., 2016). The mollusk Bellamya purificata has a high demand in terms of water quality. Wu et al. analyzed the benthic community in West Lake after water diversion and found that the number of Bellamya purificata increased significantly in West Lake after ecological engineering (Wu et al., 1999). This finding indicated that Bellamya purificata could be used as an indicator for the freshwater environment. Although the biomass of mollusks accounted for a large percentage in treatment group 3 and the control group, the density of oligochaete species was also found to occupy a large proportion. These results suggested that the freshwater of treatment group 3 and the control group also experienced pollution to some extent.
3.3.3 Species diversity of macrobenthos
The Goodnight−Whitley biological index (IGW) reflects the living conditions of oligochaetes, which could indicate the pollution conditions of freshwater to a certain extent (Magurran, 2003; Ma et al., 2008; Duan et al., 2010; Berezina et al., 2016).
Through this study, it was found that the Goodnight−Whitley biological index of the control group was 68.8%. The corresponding density of the control group was 181.33 ind/m2. These data indicated that the freshwater in the control group was affected by medium eutrophication. The Goodnight−Whitley biological indices were found to be 22.5%, 7.4%, and 12.2% for treatment groups 1, 2, and 3, respectively. The corresponding densities were 49.78 ind/m2, 1.78 ind/m2, and 47.00 ind/m2. Based on these results, it was inferred that the freshwater in treatment groups 1, 2, and 3 was clean water (as shown in Figure S6 in the Supplementary Material).
In this study, a total of 29 species of macrobenthos were collected in the testing area in the Xixi Wetland. These species belonged to 3 families, 6 classes and 16 families. Among all, mollusks accounted for the greatest number of species. The most dominant species in the sampling region were Bellamya purificata, Branchiura sowerbyi, and Limnodrilus hoffmeisteri. This finding was consistent with the dominant species identified in a study by Lu et al., which investigated macrobenthos in the Xixi wetland ecosystem (Lu et al., 2013). Therefore, these species could be used as indicators of change in the Xixi wetland environment. When evaluating the quality of freshwater using biological indicators, it was found that the water quality of the treatment groups was better than that of the control group. In particular, Branchiura sowerbyi and Limnodrilus hoffmeisteri, two types of oligochaetes used as stain-resistance indicators, had the greatest density and accounted for the highest fraction in the control group. This feature was in agreement with the trend represented by the Goodnight-Whitley biological index and further indicated poor water quality in the control group. In contrast, no oligochaetes were found in treatment group 2, indicating that the water quality of treatment group 2 was better than that of the other groups. Consistent water quality evaluation results were obtained by using either biological or chemical indicators; treatment group 2 had the best water quality and the best water purification performance.
4 Conclusions
This study demonstrated that the reconstruction and restoration of aquatic biological communities in urban pond ecosystems could provide better freshwater purification performance in urban pond ecosystems. In particular, a combination of biodiversities of aquatic animals and aquatic plants could provide the best water purification performance. It was also found in the study that Bellamya purificata (a type of macrobenthos) was a dominant species in the local urban pond ecosystem and could also be used as a biological indicator species for monitoring the change in freshwater quality. Similarly, the Oligochaeta species, another type of macrobenthos, were also good biological indicators for monitoring changes in freshwater quality. Consistent evaluation results of the change in freshwater quality were obtained from biological monitoring indicators and chemical monitoring indicators. Finally, this study demonstrated that maintaining biodiversity over different trophic levels could yield the best freshwater purifying performance in urban pond ecosystems.
Disclosure statement
No potential conflict of interest was reported by the authors.
Supplementary Material
Table S1. The Euclidean distance matrix of in terms of abiotic indicators.
Table S2. The Euclidean distance matrix of in terms of biotic indicators.
Fig. S1. The hierarchical structural diagram of aquatic plants and aquatic animals (fish).
Fig. S2. Planar spatial distribution map of aquatic plant floating islands in treatment group 2.
Fig. S3. Statistics of the biomass of the two floating island plants, including Myriophyllum aquaticum and Hydrocotyle vulgaris over four seasons.
Fig. S4. Density of macrobenthos in the testing area.
Fig. S5. Biomass of macrobenthos in the testing area.
Fig. S6. Goodnight-Whitley biological indices of macrobenthos in the testing area.
Access Supplementary MaterialAcknowledgements
The study was supported by the Chinese National Scientific and Technical Supporting Program (grant no. 2012BAC13B02).
References
- Berezina NA, Gubelit YI, Polyak YM, Sharov AN, Kudryavtseva VA, Lubimtsev VA, Petukhov VA, Shigaeva TD. 2016. An integrated approach to the assessment of the eastern gulf of Finland health: a case study of coastal habitats. J Mar Syst 171: 159–171 [Google Scholar]
- Biggs J, Williams P, Whitfield M, Nicolet P, Weatherby A. 2005. 15 years of pond assessment in Britain: results and lessons learned from the work of Pond Conservation. Aquat Conserv 15: 693–714 [CrossRef] [Google Scholar]
- Boeker C, Lueders T, Mueller M, Pander J, Geist J. 2016. Alteration of physico-chemical and microbial properties in freshwater substrates by burrowing invertebrates. Limnologica 59:131–139 [Google Scholar]
- Brown SC, Smith K, Batzer D. 1997. Macroinvertebrate responses to wetland restoration in northern New York. Environ Entomol 26: 1016–1024 [Google Scholar]
- Chen T, Zhang Y, Gao Y, Fei Y, Ding Y, Gao F. 2016. Different combination of fishes, benthic animals and aquatic plants control of eutrophication water bodies by mesocosm experiment. Chin J Environ Eng 10: 5511‑5520. [Google Scholar]
- Clarke SJ, Wharton G. 2001. Sediment nutrient characteristics and aquatic macrophytes in lowland English rivers. Sci Total Environ 266: 103–112. [Google Scholar]
- De Meester L, Declerck S, Stoks R, Louette G, Van De Meutter F, De Bie T, Michels E, Brendonck L. 2005. Ponds and pools as model systems in conservation biology, ecology and evolutionary biology. Aquat Conserv 15: 715–725. [Google Scholar]
- Duan X, Wang Z, Xu M. 2010. Benthic macroinvertebrate and application in the assessment of stream ecology. Beijing: Tsinghua University Press. [Google Scholar]
- Eivers RS, Duggan IC, Hamilton DP, Quinn JM. 2018. Constructed treatment wetlands provide habitat for zooplankton communities in agricultural peat lake catchments. Wetlands 38: 95–108. [Google Scholar]
- García-Chicote J, Armengol X, Rojo C. 2018. Zooplankton abundance: a neglected key element in the evaluation of reservoir water quality. Limnologica 69: 46–54. [Google Scholar]
- Geist J, Hawkins SJ. 2016. Habitat recovery and restoration in aquatic ecosystems: current progress and future challenges. Aquat Conserv Mar Freshw Ecosyst 26: 942–962 [Google Scholar]
- González-Ortegón E, Walton MEM, Moghaddam B, Vilas C, Prieto A, Kennedy HA, Pedro Cañavate J, Le Vay L. 2015. Flow regime in a restored wetland determines trophic links and species composition in the aquatic macroinvertebrate community. Sci Total Environ 503–504: 241‑250. [Google Scholar]
- Granéli W, Solander D. 1988. Influence of aquatic macrophytes on phosphorus cycling in lakes. Hydrobiologia 170: 245–266. [Google Scholar]
- Hassall C. 2014. The ecology and biodiversity of urban ponds. Wiley Interdiscipl Rev Water 1: 187–206. [Google Scholar]
- Hill MJ, Biggs J, Thornhill I, Briers RA, Gledhill DG, White JC, Wood PJ, Hassall C. 2017. Urban ponds as an aquatic biodiversity resource in modified landscapes. Glob Change Biol 23: 986–999. [Google Scholar]
- http://www.fao.org/giahs/background/en/ [Google Scholar]
- http://www.fao.org/giahs/giahsaroundtheworld/designated-sites/asia-and-the-pacific/huzhou-mulberry-dyke-fish-pond-system/zh/ [Google Scholar]
- Kail J, Brabec K, Poppe M, Januschke K. 2015. The effect of river restoration on fish, macroinvertebrates and aquatic macrophytes: a meta-analysis. Ecol Indic 58: 311–321. [Google Scholar]
- Lu J, Fu Z, Yin Z. 2008. Performance of a water hyacinth (Eichhornia Crassipes) system in the treatment of wastewater from a duck farm and the effects of using water hyacinth as duck feed. J Environ Sci 20: 513–519. [Google Scholar]
- Lu Q, Chen H, Shao X, Wang Y, Tao M, He J, Tang L. 2013. Ecological characteristics of macrobenthic communities and its relationships with environmental factors in Hangzhou Xixi Wetland. Acta Ecol Sin 33: 2803–2815. [Google Scholar]
- Ma T, Huang Q, Wang H, Wang Z, Wang C, Huang S. 2008. Selection of benthic macroinvertebrate-based multimetrics and preliminary establishment of biocriteria for the bioassessment of the water quality of Taihu Lake, China. Acta Ecol Sin 28: 1192–1200. [Google Scholar]
- Magurran AE. 2003. Measuring Biological Diversity. Wiley-Blackwell: 1 edition [Google Scholar]
- McDonald RI, Kareiva P, Rtt F. 2008. The implications of current and future urbanization for global protected areas and biodiversity conservation. Biol Conserv 141: 1695–1703. [Google Scholar]
- McMeans BC, Mccann KS, Humphries M, Rooney N, Fisk AT. 2015. Food web structure in temporally-forced ecosystems. Trends Ecol Evol 30: 662–672. [Google Scholar]
- Olguín EJ, Sánchez-Galván G, Melo FJ, Hernández VJ, González-Portela RE. 2017. Long-term assessment at field scale of floating treatment wetlands for improvement of water quality and provision of ecosystem services in a eutrophic urban pond. Sci Total Environ 584-585: 561–571. [Google Scholar]
- Pander J, Geist J. 2013. Ecological indicators for stream restoration success. Ecol Indic 30: 106–118. [Google Scholar]
- Pedersen ML, Friberg N, Skriver J, Baattrup-Pedersen A, Larsen SE. 2007. Restoration of skjern river and its valley—short-term effects on river habitats, macrophytes and macroinvertebrates. Ecol Eng 30: 145–156. [Google Scholar]
- Population Division of the Department of Economic and Social Affairs of the United Nations. 2014. World Urbanization Prospects: The 2014 Revision, Highlights. https://population.un.org/wup/Publications/Files/WUP2014-Highlights.pdf [Google Scholar]
- Population Division of the Department of Economic and Social Affairs of the United Nations. 2018. World Urbanization Prospects: The 2018 Revision, Key Facts. https://population.un.org/wup/Publications/Files/WUP2018-KeyFacts.pdf [Google Scholar]
- Salánki J, Farkas A, Kamardina T, Rózsa KS. 2003. Molluscs in biological monitoring of water quality. Toxicol Lett 140: 403–410. [Google Scholar]
- Schindler DW. 2006. Recent advances in the understanding and management of eutrophication. Limnol Oceanogr 51: 356–363. [CrossRef] [Google Scholar]
- Seto KC, Güneralp B, Hutyra LR. 2012. Global forecasts of urban expansion to 2030 and direct impacts on biodiversity and carbon pools. Proc Natl Acad Sci USA 109: 16083–16088. [Google Scholar]
- Smith VH, Schindler DW. 2009. Eutrophication science: where do we go from here? Trends Ecol Evol 24: 201–207. [Google Scholar]
- Thomson J, Hart D, Charles D, Nightengale T, Winter D. 2005. Effects of removal of a small dam on downstream macroinvertebrate and algal assemblages in a Pennsylvania stream. Freshw Sci 24: 192–207. [Google Scholar]
- Turker H, Eversole AG, Brune DE. 2003. Comparative Nile tilapia and silver carp filtration rates of partitioned aquaculture system phytoplankton. Aquaculture 220: 449‑457. [Google Scholar]
- Vymazal J. 2007. Removal of nutrients in various types of constructed wetlands. Sci Total Environ 380: 48–65. [CrossRef] [PubMed] [Google Scholar]
- Wang H, Liang Y. 2001. A preliminary study of oligochaetes in Poyang Lake, the largest freshwater lake of China, and its vicinity, with description of a new species of Limnodrilus . Hydrobiologia 463: 29–38. [Google Scholar]
- Wu J, Wang R, Yu J, Yu Z, Shen X. 1999. Macrozoobenthos communities of West Lake after drawing fresh water from Qiantang River. Environ Pollut Control 21: 25–29. [Google Scholar]
- Xie P, Liu J. 2001. Practical success of biomanipulation using filter-feeding fish to control cyanobacteria blooms: a synthesis of decades of research and application in a subtropical hypereutrophic lake. Sci World J 1: 337–356. [Google Scholar]
- Yang W, Sun T, Yang Z. 2016. Does the implementation of environmental flows improve wetland ecosystem services and biodiversity? A literature review. Restorat Ecol 24: 731–742. [Google Scholar]
- Yao J, Sánchez-Pérez JM, Sauvage S, Teissier S, Attard E, Lauga B, Duran R, Julien F, Bernard-Jannin L, Ramburn H, Gerino M. 2017. Biodiversity and ecosystem purification service in an alluvial wetland. Ecol Eng 103: 359–371. [Google Scholar]
- Zhao Y, Fang Y, Jin Y, Huang J, Ma X, He K, He Z, Wang F, Zhao H. 2015. Microbial community and removal of nitrogen via the addition of a carrier in a pilot-scale duckweed-based wastewater treatment system. Bioresour Technol 179: 549–558. [Google Scholar]
- Zhao Z, Shi H, Liu Y, Zhao H, Su H, Wang M, Zhao Y. 2014. The influence of duckweed species diversity on biomass productivity and nutrient removal efficiency in swine wastewater. Bioresour Technol 167: 383–389. [Google Scholar]
Cite this article as: Liu F, Lu J. 2021. Ecological engineering approaches to restoring the aquatic biological community of an urban pond ecosystem and its effects on water quality ‑ a case study of the urban Xixi National Wetland Park in China. Knowl. Manag. Aquat. Ecosyst., 422, 24.
All Tables
Distribution and dominance of macrobenthic fauna in Xixi wetland experimental ponds.
All Figures
|
Fig. 1 The remote-sensing image showing the spatial distribution of the testing urban ponds of Xixi Wetland. |
| In the text | |
|
Fig. 2 The trees of system cluster among treatments in terms of abiotic (a) and biotic (b) indicators. |
| In the text | |
|
Fig. 3 The average transparency value and the statistical results of the different treatment groups. |
| In the text | |
|
Fig. 4 The average DO value and the statistical results of the different treatment groups. |
| In the text | |
|
Fig. 5 The average TN value and the statistical results of the different treatment groups. |
| In the text | |
|
Fig. 6 The average TP value and the statistical results of the different treatment groups. |
| In the text | |
|
Fig. 7 The average CODMn value and the statistical results of the different treatment groups. |
| In the text | |
Current usage metrics show cumulative count of Article Views (full-text article views including HTML views, PDF and ePub downloads, according to the available data) and Abstracts Views on Vision4Press platform.
Data correspond to usage on the plateform after 2015. The current usage metrics is available 48-96 hours after online publication and is updated daily on week days.
Initial download of the metrics may take a while.