| Issue |
Knowl. Manag. Aquat. Ecosyst.
Number 418, 2017
|
|
|---|---|---|
| Article Number | 27 | |
| Number of page(s) | 9 | |
| DOI | https://doi.org/10.1051/kmae/2017019 | |
| Published online | 16 June 2017 | |
Research Paper
Climatic niche shift of aquatic plant invaders between native and invasive ranges: a test using 10 species across different biomes on a global scale
Changement de niche climatique de plantes aquatiques invasives des habitats natifs aux habitats envahis : un test utilisant 10 espèces de différents biomes à une échelle globale
School of Nature Conservation, Beijing Forestry University,
Beijing
100083, China
* Corresponding author: This email address is being protected from spambots. You need JavaScript enabled to view it.
Abstract
Environmental niche conservatism defines a concept, stating that species could live in the same environmental condition in both native and invasive ranges. Niche modeling often used this as basis for the prediction of the range of invasive plants. However, it is debatable whether environmental niches of invasive plant species are conserved or shift between native and invasive ranges. Only few studies have investigated such a shift in aquatic plant invaders (APIs) on a meaningful global scale. Environmental niche modeling was used to project climatic niche distributions of 10 APIs based both on the native range and the invasive range of species. We found that niche shifts of APIs between native and invasive ranges may occur throughout the world. Moreover, we found niche shifts of APIs between native and invasive ranges across different biomes. The largest climatic niche shift was detected for Najas minor and the smallest for Alternanthera philoxeroides. For all 10 APIs, overlap between both ranges was maximal for large river deltas, while overlap was minimal for temperate floodplain rivers and wetlands. For APIs, the suitability of the climatic habitat was highest in temperate coastal rivers for invasive models in invasive ranges. More importantly, based on invasive models, climatic suitability was significantly higher for temperate coastal rivers and temperate floodplain rivers and wetlands in invasive ranges and compared to native models. We suggest to integrate climatic niches of both native and invasive ranges into projections of the global climatic niche distribution of APIs.
Résumé
Le conservatisme de niche environnementale définit un concept, affirmant que les espèces pourraient vivre dans les mêmes conditions environnementales dans les habitats indigènes et invasifs. La modélisation de niche a souvent servi de base à la prédiction de l'extension des plantes envahissantes. Cependant, cela est discutable si les niches environnementales des espèces de plantes envahissantes sont conservées ou se modifient entre les aires indigènes et invasives. Seules quelques études ont étudié un tel changement chez les plantes aquatiques invasives (API) à une échelle mondiale significative. La modélisation de niche environnementale a été utilisée pour projeter des distributions de niches climatiques de 10 API basées à la fois sur la répartition native et invasive d'espèces. Nous avons constaté que des changements de niche des API entre les aires indigènes et invasives peuvent se produire dans le monde entier. En outre, nous avons trouvé des changements de niche des API entre les aires indigènes et invasives entre différents biomes. Le plus grand changement de niche climatique a été détecté chez Najas minor et le plus petit pour Alternanthera philoxeroides. Pour les 10 API, le chevauchement entre les deux aires de répartition était maximal pour les grands deltas des rivières, alors que le chevauchement était minimal pour les rivières de plaine inondable et les zones humides. Plus important encore, selon les modèles d'invasion, la pertinence climatique était significativement plus élevée pour les rivières côtières tempérées et les rivières de plaine inondable et les zones humides tempérées dans les aires envahies comparées aux aires indigènes. Nous suggérons d'intégrer les niches climatiques des aires indigènes et invasives dans les projections de la répartition mondiale des niches climatiques des API.
Key words: climatic niche shift / aquatic plant species / biomes / niche overlap / plant invasion /
Mots clés : changement de niche climatique / plantes aquatiques / biomes / chevauchement de niche / plantes invasives
These authors contributed equally to this work.
© C.-J. Wang et al., Published by EDP Sciences 2017
 This is an Open Access article distributed under the terms of the Creative Commons Attribution License CC-BY-ND (http://creativecommons.org/licenses/by-nd/4.0/), which permits unrestricted use, distribution, and reproduction in any medium, provided the original work is properly cited. If you remix, transform, or build upon the material, you may not distribute the modified material.
1 Introduction
From an environmental management perspective, aquatic plant invaders (APIs) are a growing concern, because they constitute 11% (4 of 36) of the world's most invasive plant species; additionally, they pose a threat to biodiversity, ecosystem balance, and water bodies (Hussner, 2012; Leppäkoski et al., 2013; Svirčev et al., 2014; Luque et al., 2014). The environmental niche describes the response of APIs to the distribution of suitable habitats. The expansion and evolution of APIs in non-native ranges, and their propagation along barriers may instill an environmental niche shift. Previous studies have also shown that environmental niche shift is related to human influence (Riis et al., 2012; Hussner, 2012; Donoghue and Edwards, 2014; Svirčev et al., 2014; Nunes et al., 2015). API seedlings have been imported to non-native regions for ecological restoration, agricultural production, or even as ornamental plants (De Groot et al., 2002; Leppäkoski et al., 2013; Riis et al., 2012; Kaufman and Kaufman, 2013). Additionally, a period of repeated human colonization in relation to plasticity, establishment, and genetic evolution can result in a successful niche shift. Plasticity is the ability of an individual plant species to alter its physiology or morphology in response to changes of environmental conditions (Nunes et al., 2015; Donoghue and Edwards, 2014; Guisan et al., 2014). Hence, some degree of plasticity allowing at least the temporarily establishment of individual plants enables subsequent climatic niche evolution (Zhu et al., 2013; Guisan et al., 2014; Nunes et al., 2015). The interaction between the climatic niche shift of APIs and their expansion into invasive ranges is rather complex (Petitpierre et al., 2012; Guisan et al., 2014; Larson et al., 2014). This report uses the premise of climatic niche shifts as basis for a risk assessment of APIs.
Environmental niche modeling (ENM) was used to predict the ability of alien plant species to inhabit and thrive in invasive ranges, based on environmental niche conservatism. In fact, invasion ecologists have used ENMs to model suitable climatic habitats of APIs, based on climatic factors for the risk assessment of API invasion (Zhu et al., 2013; Montecino et al., 2014; Natalie and Myla, 2015). In particular, a study by Natalie and Myla (2015) modeled both range expansion and habitat preferences of three APIs in the United States. Their results led to the suggestion that land managers in the northeastern United States should concentrate on both early detection and rapid response management for API invasion in lakes, ponds, and man-made wetland habitats. Furthermore, Zhu et al. (2013) used MAXENT modeling to project potential distributions of Spartina alterniflora on a global scale, based on the transferability of ENM predictions between native and invasive ranges. Climatic niche conservatism is the key assumption for the evaluation of the impact of climate change on distributions of invasive plant species (Petitpierre et al., 2012; Wiens and Graham, 2005; Töpel et al., 2012; Corlett and Westcott, 2013). Previous studies reported climatic factors to be an important driving force behind plant invasion into non-native regions, because invasive plant species typically spread into areas with climatic conditions, similar to their native habitat; this is referred to as climatic niche conservatism (Petitpierre et al., 2012; Corlett and Westcott, 2013; Donoghue and Edwards, 2014). Climatic niche conservatism is widespread among terrestrial plant invaders (Petitpierre et al., 2012). However, it has recently been reported that large-scale validations of the equilibrium assumption, using native and naturalized distributions, are not generally applicable. This was based on a comparison between climatic niches that had been evaluated by occurrence records of native ranges and invasive ranges (Early and Sax, 2014). Considerable variability within published data renders the principle of climatic niche conservatism debatable. However, these studies all focused on climatic niche shifts of terrestrial plant invaders, while only few studies have provided evidence of climatic niche shifts in APIs (Petitpierre et al., 2012).
ENMs can be used to evaluate the expansion risk of particular APIs into non-native regions based on their climatic niche. Furthermore, suggestions for both prevention and control of APIs have been proposed based on the potential API distribution, using data provided by ENMs (Zhu et al., 2013; Montecino et al., 2014; Natalie and Myla, 2015). Modeling the potential distribution of invaded species should ideally be based on occurrence data of the native ranges, rather than that of the invasive ranges, since the species might not reach the full range of habitable space an invaded region (Medley, 2010; Petitpierre et al., 2012). Moreover, climatic niche shifts of APIs between native and invasive ranges increase uncertainty levels of niche structure and species lability, thus decreasing the reliability of ENMs for invasion risk predictions (Petitpierre et al., 2012).
Based on all of the previously described information, we addressed two scientific questions: (1) what is the extent of climatic niche shift between the native and invasive ranges of APIs? and (2) what are the differences in niche shifts of APIs between native and invasive niches across different freshwater biomes?
A biome is a formation of plant species with common characteristics due to similar climatic conditions that can be found across various continents (Abell et al., 2008). Hence, biomes may provide novel insights into the climatic niche of APIs (Petitpierre et al., 2012; Larson et al., 2014). Here, 10 APIs with the most extensive global invasion were used to model the climate space of native and invasive ranges to test the niche shift of these APIs on a global scale. The niche shifts of APIs across different freshwater biomes were also examined.
2 Method and materials
2.1 Species data
The Invasive Species Specialist Group (ISSG) identified several species that provide a representative set of the most widespread and dangerous APIs in the world (http://www.issg.org/; accessed in August 2016). These APIs share two main characteristics: they significantly impact the invaded ecosystems and they possess general functional traits that promote invasion (http://www.issg.org/; accessed in August 2016) (Lowe et al., 2000). In addition to API identification, the ISSG also identified their invasive and native ranges. Occurrence data and primary geographic coordinates for each API were obtained from the Global Biodiversity Information Facility (GBIF; www.gbif.org; accessed in August 2016). Duplicate occurrences of recorded data for species in 5.0-arc-minute grid pixels (10 km at the equator) were removed to avoid georeferencing errors (Beck et al., 2014). To decrease the negative effect of sampling bias on the performance of ENMs, 10 species with more than 50 unique records for both native and invasive ranges were selected; the entire globe was used as the extent of the input data (Varela et al., 2014) (Tab. 1). The distribution of the species occurrence data as the training dataset of ENM was obtained from the ISSG to incorporate global distribution data. Invasive and native ranges were obtained from the ISSG (http://www.issg.org/; accessed in August 2016; Tab. S1).
Number of occurrence localities, AUC values, and climatic niche overlap between native and invasive models for aquatic plant invaders (APIs). Native and invasive (the subscripts in this table) represent native and invasive models, respectively. Record represents the number of occurrence localities based on both native and invasive models, respectively. AUC represents the AUC values of MAXENT modeling based on the occurrence localities of native and invasive models, respectively. Dobs represents Schoener's D for APIs between native and invasive models and Dnull represents Schoener's D outside of the 95% confidence limits for each API based on the null model. Dobs values smaller than Dnull significantly support niche shift. VS NA and VS IN (the subscripts in this table) represent niche overlap between all models and the native models (or invasive models). The code of I was similar to D. Bold values represent significant climatic niche shift between native and invasive ranges based on the null model. SD, standard deviation.
2.2 Climatic variables
Nineteen bioclimatic variables, ranging from 1950 to 2000 (with 5.0-arc-minute spatial resolution) were downloaded from the WorldClim database (www.worldclim.org; accessed in August 2016). A multi-collinearity test was conducted among the 19 bio-climatic variables based on the Pearson's correlation coefficient to eliminate highly correlated variables from the final modeling procedure. We excluded variables with a cross-correlation coefficient value of >±0.8. The resulting eight bioclimatic variables represent numerous factors, including general trends (means), variation (seasonality), and limiting variables (minimum and maximum temperatures) and are closely related to both distribution and physiological performance of plant species (Tab. S2; Grimaldo et al., 2016).
2.3 Climatic niche shift analysis
We used two methods to analyze climatic niche shifts of APIs between native and invasive ranges: principal component analysis (PCA) and ENM.
First, we used PCA to quantify the climatic space, thus illustrating environmental niche shifts of APIs between native and invasive ranges, based on occurrence records and relevant climatic variables (Medley, 2010). Based on the observed occurrences for each species, a two-dimensional climatic space was defined where the first two axes were identified via PCA (Medley, 2010). Thus, the observed climatic niches of APIs between native and invasive ranges could be obtained via PCA (Medley, 2010). The PCA was conducted in JMP 10.0 (SAS, USA).
Then, we generated reciprocal models by running one model with the native occurrence records based on ENM, while running the other model using the invasive occurrence records in both native and invasive ranges (Medley, 2010). Reciprocal models are good tools to reveal niche shifts for plant invasion (Medley, 2010). MAXENT (ver.3.3.3; http://www.cs.princeton.edu/∼schapire/maxent/; accessed in August 2016) was used as a common ENM to model native and invasive niches of APIs in climatic space. This was done based on bioclimatic variables and occurrence localities using native (native model), invasive ranges (invasive model), and both native and invasive ranges (all model) (Warren et al., 2008; Václavík et al., 2012). All pixels were regarded as parts of the possible climate space of native and invasive ranges for the globally distributed APIs (Kolanowska, 2013). A logistic output format was used to visualize the identified potential niches of these APIs in the climate space of native and invasive ranges based on MAXENT modeling (Václavík et al., 2012). For climatic niche maps based on native and invasive ranges, each pixel had a value ranging from 0 to 1, with 0 representing the lowest climatic suitability of (not suitable at all) and representing 1 the highest climatic suitability (completely suitable) (Phillips et al., 2006; Warren et al., 2008). In accordance with a previously described protocol (Phillips et al., 2006), 10,000 background points were selected for pseudo-absence data based on the native and invasive ranges. Auto features were used and other values were retained at default settings provided by Warren et al. (2008).
Shifts between climatic niches in native and invasive ranges on a global scale were also examined based on the niche overlap (Schoener's D (D)) and a measure derived from the Hellinger distance (I); this was evaluated using ENMTools 1.4.4 (Warren et al., 2008, 2010; Oke and Thompson, 2015). Furthermore, the niche overlaps between all models and native models or invasive models were quantified via D and I. We then used the background randomization test of ENMTools 1.4.4 to test this null model, thus ensuring any observed climatic niches and the API background environment were divergent in the same way for each API (Warren et al., 2008, 2010). Each pseudo-replicate dataset was produced as follows: the number of background points of the pseudo-replicate datasets for the native range equaled the number of known occurrences in the native range; furthermore, the number of background points in the pseudo-replicate datasets for the invasive range equaled the number of known occurrences in the invasive range. Niche overlap was determined with the same method to build climatic niche models based on 100 pseudo-replicate datasets (Warren et al., 2008, 2010). Using a one tailed t-test, the observed niche overlap (Dobs and Iobs) between native and invasive models was compared to the niche overlap from the null distributions (Dnull and Inull). The observed niche overlap (Dnull and Inull) was considered significant if it was outside the 95% confidence limits of Dnull (or Inull). Based on the observed and null D and I values, climatic niche relationships were determined and a niche shift was defined significant when Dobs (or Iobs) < Dnull (or Inull; Warren et al., 2008, 2010).
Finally, we computed D values for each API in the native and invasive ranges based on climate spaces between native and invasive models across 12 freshwater biomes (Abell et al., 2008). The following classes were used to facilitate interpretation of niche overlap based on D values: 0–0.2 = no or very limited overlap, 0.2–0.4 = low overlap, 0.4–0.6 = moderate overlap, 0.6–0.8 = high overlap, 0.8–1.0 = very high overlap (Rödder and Engler, 2011).
We used the following equation to compute climatic suitability of 12 freshwater biomes based on native and invasive models in both native and invasive ranges, respectively:
 where Sj is the climatic suitability for each API in the biome j; n is the total number of pixels in the biome j; Xi is the value of climatic suitability of API i in each pixel; and Yi is the area percentage of climatic suitability of API i in biome j. The global scale map of 12 main freshwater biomes was downloaded from www.feow.org (accessed in August 2016; Abell et al., 2008; Rödder and Engler, 2011) (Fig. 1). Then, we tested for climatic suitability, using non-parametric tests based on ten APIs to assess differences between native and invasive models across 12 freshwater biomes.
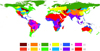 |
Fig. 1 Global distribution of freshwater biomes. Codes: 1, large lakes; 2, large river deltas; 3, montane freshwaters; 4, oceanic islands; 5, polar freshwaters; 6, temperate coastal rivers; 7, temperate floodplain rivers and wetlands; 8, temperate upland rivers; 9, tropical and subtropical coastal rivers; 10, tropical and subtropical floodplain rivers and wetland complexes; 11, tropical and subtropical upland rivers; 12, xeric freshwaters and endorheic (closed) basins. |
2.4 Model evaluation
The area under the receiver operating characteristic curve (AUC) was used to evaluate the MAXENT accuracy. Models with AUC values below 0.7 were not taken into account based on a study by Phillips et al. (2006), suggesting these cutoff values to increase model accuracy (Phillips et al., 2006). We then used a binomial test based on omission rate to evaluate the performance of MAXENT modeling for the 10 APIs (Phillips et al., 2006). Training omission rate was the proportion of test occurrence localities measured in pixels of predicted absence (Phillips et al., 2006). These one-sided tests evaluate the null hypothesis that test points are predicted no better than via random prediction (Phillips et al., 2006). Binomial probabilities were based on eight common thresholds defaulted by MAXENT modeling (for detailed information, see Tab. S3). Although the training omission rate may not have been sufficient, an omission rate below 17% is a prerequisite for a suitable model (Phillips et al., 2006).
3 Results
All the climatic niche models (including native and invasive models based on 100 pseudo-replicate datasets) had AUC values above 0.7 for the training data sets and a low training omission rate (below 17%), indicating good accuracy of each model (Tab. 1). Based on PCA, we found a possible climatic niche shift between native and invasive ranges across some species such as Ceratophyllum demersum, Crassula helmsii, Elodea canadensis, Hydrilla verticillata, Najas minor, Potamogeton crispus, and Sagittaria platyphylla (Fig. 2). Using the null model, the number of Dobs (or Iobs) below Dnull (or Inull) was 100 for each API, except for the I value of A. philoxeroides (namely, outside the 100% confidence limits of Dnull (or Inull) for APIs). Hence, a significant niche shift was present between the native and invasive models in all 10 APIs (Dobs < Dnull and Iobs < Inull except for A. philoxeroides; Tab. 1).
D for these 10 APIs ranged from 0.151 to 0.600 (mean ± SD: 0.413 ± 0.124) indicating low or moderate niche overlap between native and invasive models, and a range of I from 0.425 to 0.841 (mean ± SD: 0.702 ± 0.111; Tabs. 1 and S2; Fig. S1). Both D and I were minimal for N. minor, while they were maximal for A. philoxeroides (Tab. 1; Fig. S1). For N. minor, we found that the distribution of high climatic suitability did not match the invasive ranges based on the native model. Furthermore, we could not use the invasive model to predict distributions of suitable climatic habitats in native ranges, further indicating large climatic niche shifts between native and invasive ranges (Fig. 3). Moreover, we found that the niche overlap between the set of all models and native models [(mean D: 0.668; mean I: 0.688) or invasive models (mean D: 0.893; mean I: 0.902)] was larger than the overlap between native and invasive models across all 10 APIs (Tab. 1). This result indicates that the use of native and invasive occurrence records could decrease prediction uncertainty due to an environmental niche shift between native and invasive ranges (Tab. 1). Consequently, the model transferability of APIs between native and invasive ranges could be improved.
The range of climatic niche overlap between both models (calculated D values) varied from 0.392 ± 0.123 to 0.882 ± 0.187, suggesting low, moderate, high, and very high niche overlap across different freshwater biomes. The calculated I values varied from 0.698 ± 0.122 to 0.958 ± 0.073 based on 12 freshwater biomes (Tab. 2; Fig. 1). These results indicate maximal overlap between native and invasive models in large river deltas, while temperate floodplain rivers and wetlands have minimal overlap (Tab. 2; Fig. 1). We found maximal climatic habitat suitability of APIs for tropical and subtropical coastal rivers based on native models, and for temperate coastal rivers based on the invasive models of invasive ranges. Suitability was minimal for polar freshwaters of native ranges and for large river deltas of invasive ranges for both models (Tab. 2). Based on native ranges and between models, we detected significant differences of climatic suitability for large lakes, temperate coastal rivers, temperate floodplain rivers and wetlands, tropical and subtropical coastal rivers, and tropical and subtropical upland rivers (all P values <0.05). Compared to native models, climatic suitability was significantly better for invasive models in temperate coastal rivers, and temperate floodplain rivers and wetlands, based on invasive ranges (Tab. 2; Fig. 1). Furthermore, the climatic suitability of APIs for native ranges was significantly lower for the invasive model compared to the native model (all P values <0.05; Tab. 2).
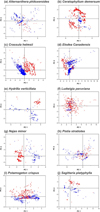 |
Fig. 2 Climatic space of aquatic plant invaders based on principal component analysis. Red points represent occurrence records of native regions, while blue points represent occurrence records of invasive regions. |
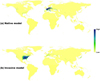 |
Fig. 3 Map of climatic suitability of Najas minor for native (a) and invasive models (b). |
Summary of climatic suitability and niche overlap for all 10 aquatic plant invaders (APIs) in all 12 freshwater biomes. Numerical data is represented as mean ± SD; D represents Schoener's D for APIs between native and invasive models on both native and invasive ranges; I represents a measure derived from the Hellinger distance and is called I based on both the native and invasive ranges; the biome codes are identical to those in Figure 1. The invasive model is based on the distribution records of invasive ranges and the native model is based on the distribution records of native ranges. Bold values represent significant differences between native and invasive models based on the null model. SD, standard deviation.
4 Discussion
Climatic niche shift of APIs between native and invasive ranges is a valuable component for an appropriate prediction of plant invasion (Donoghue and Edwards, 2014; Guisan et al., 2014; Petitpierre et al., 2012; Wiens and Graham, 2005; Early and Sax, 2014). Issues of climatic niche shift have widely been discussed for plant invaders based on ENMs (Petitpierre et al., 2012; Kolanowska, 2013; Montecino et al., 2014; Wiens and Graham, 2005; Early and Sax, 2014). Here, we focused on aquatic invasive species using MAXENT modeling as a common ENM. Interestingly, our data indicate that based on null model testing using MAXENT modeling, the climatic niches of all 10 tested APIs changed on a global scale between native and invasive ranges (Tab. 1).
Collectively, these studies provide an important basis through which existing models can be improved or new models can be developed; these studies can also be used to predict the distribution of invasive plants, both terrestrial and aquatic. However, it is necessary to consider niche conservatism of APIs with respect to native climatic conditions when using ENMs to predict suitable climatic habitat distributions. Niche conservatism implies that the plant species grow and survive in invasive environmental conditions that are similar to their native ranges. The theory of niche conservatism is the basis to maintain the transferability of ENMs and to improve model performance. However, the considerable climatic niche shift of APIs between native and invasive ranges may result in a reduction of ENM transferability, and the climatic suitability of APIs may significantly increase in invasive ranges for several biomes (for detailed information, see Tab. 2). Hence, we must take into account the effects of climatic niche shift on habitat suitability in invasive ranges, when these are modeled via ENMs. We found that occurrence records of native ranges combined with invasive ranges improve model transferability of APIs between native and invasive ranges. Based on our results (Tab. 1) and considering previous studies, we suggest the use of occurrence locality records of both native and invasive ranges in ENMs to increase the accuracy of projections of climatic niche distributions of APIs on a global scale (Broennimann and Guisan, 2008; Kolanowska, 2013; Kelly et al., 2014; Fernández and Hamilton, 2015; Mainali et al., 2015). For example, Mainali et al. (2015) reported improved prediction performance of ENMs of Parthenium hysterophorus L. (Asteraceae) with the distribution occurrences from both native and invasive ranges. Therefore, it is important to obtain a large volume of occurrences to generate accurate predictions with ENMs (Donaldson et al., 2014; Mainali et al., 2015). Additionally, our study may provide an important theoretical basis for the future prediction of APIs in invasive ranges based on ENMs and aid further studies that study invasion mechanism(s) of APIs on a global scale.
Niche evolution of APIs may promote niche shift in invasive ranges along a biome gradient via population dynamics, community interactions, and genetics of colonization (Donoghue and Edwards, 2014; Wiens and Graham, 2005). Medley (2010) suggested that niche shifts should be indicated if the overlap between native and invasive models in native and invasive ranges is small. Our results indicate the existence of API niche shifts between native and invasive ranges across different biomes (Tab. 2). Climatic suitability of APIs was maximal for all 12 biomes, except for tropical and subtropical coastal rivers. Furthermore, the climatic suitability of APIs was higher based on invasive models as compared to native models in temperate coastal rivers, as well as temperate floodplain rivers and wetlands for invasive ranges (Tab. 2). Human activities are the main driving force for plant invasion; e.g., human introduction has been reported to disperse invasive plant species over long distances either on footwear or water sports equipment (Brinson and Malvárez, 2002; Donaldson et al., 2014; Callen and Miller, 2015). Furthermore, hydrological processes of catchments may affect the habitat distribution of species in freshwater biomes (Abell et al., 2008). Various human activities (such as agriculture, urban expansion, and drainage and road construction) in temperate coastal rivers as well as temperate floodplain rivers and wetlands potentially promote the spread of APIs on a global scale due to the outstanding abilities of APIs to adapt to novel conditions (Brinson and Malvárez, 2002). Large river deltas form freshwater ecoregions and these are important interfaces between continents and oceans for material fluxes which have a global impact on marine biogeochemistry (Abell et al., 2008; Bianchi and Allison, 2009). The prediction overlap between native and invasive ranges of APIs may be high due to a considerable overlap between native and invasive models for the invasive range. However, climatic habitat suitability of APIs was low for large river deltas (Tab. 2), due to large areas of habitats that are unsuitable for plants such as northern Africa and central Australia (Donoghue and Edwards, 2014; Fernández and Hamilton, 2015). Hence, API invasion will unlikely occur in invasive ranges of large river deltas.
We need to pay more attention to biomes with high climatic suitability for invasive ranges as well as small niche shifts between native and invasive ranges (e.g. oceanic islands). The same rule may not apply to minimal climatic niche overlap between the ranges, which occurred in temperate floodplain rivers and wetlands (Tab. 2). Due to their negative impact on aquatic and wetland ecosystems, both the prevention and control of API invasions are vitally important for maintaining ecosystem stability (Warfe et al., 2013; Kaufman and Kaufman, 2013; Luque et al., 2014; Svirčev et al., 2014; Nunes et al., 2015). Our results provide novel insights for risk assessments of API invasions. APIs have a large global potential to threaten ecosystems of temperate coastal rivers and oceanic islands (Kueffer et al., 2010). Hence, we assessed the degree of climatic niche shift between native and invasive ranges on a biome scale. Our results suggest that APIs could invade novel habitats of temperate coastal rivers as well as temperate floodplain rivers and wetlands, despite large niche shifts between native and invasive ranges. Due to a small niche shift, APIs currently expand into empty sites within oceanic islands, where climatic conditions mirror those in their native range (Callen and Miller, 2015).
A variety of factors, including human activity and climate change, may promote the adaptation of plant species to novel climatic conditions in non-native regions, resulting in a climatic niche shift between native and invasive ranges (Nunes et al., 2015). Hence, the transferability of ENMs supports the necessity for an accurate determination of climatic niche distributions of APIs in invasive ranges based on observed habitat suitability in both native and invasive ranges (Mainali et al., 2015; Wan et al., 2017).
Supplementary Material
Tables S1 to S6
Fig. S1
Access Supplementary MaterialAcknowledgements
We thank the anonymous reviewers for their valuable comments on an earlier version of this manuscript, and the support from the protection and management project of wild plants “Effectiveness assessment of small conservation areas: a case of Lin'an City in Zhejiang province” under the Chinese Forestry Bureau, and the Fundamental Research Funds for the Central Universities (BLYJ201606).
References
- Abell R, Thieme M, Revenga C, et al. 2008. Freshwater ecoregions of the world: a new map of biogeographic units for freshwater biodiversity conservation. Bioscience 58: 403–414. [Google Scholar]
- Beck J, Böller M, Erhardt A, Schwanghart W. 2014. Spatial bias in the GBIF database and its effect on modeling species' geographic distributions. Ecol Inform 19: 10–15. [CrossRef] [Google Scholar]
- Bianchi TS, Allison MA. 2009. Large-river delta-front estuaries as natural “recorders” of global environmental change. Proc Natl Acad Sci USA 106: 8085–8092. [CrossRef] [Google Scholar]
- Brinson MM, Malvárez AI. 2002. Temperate freshwater wetlands: types, status, and threats. Environ Conserv 29: 115–133. [CrossRef] [Google Scholar]
- Broennimann O, Guisan A. 2008. Predicting current and future biological invasions: both native and invaded ranges matter. Biol Lett 4: 585–589. [CrossRef] [PubMed] [Google Scholar]
- Callen ST, Miller AJ. 2015. Signatures of niche conservatism and niche shift in the North American kudzu (Pueraria montana) invasion. Divers Distrib 21: 853–863. [CrossRef] [Google Scholar]
- Corlett RT, Westcott DA. 2013. Will plant movements keep up with climate change? Trends Ecol Evol 28: 482–488. [Google Scholar]
- De Groot RS, Wilson MA, Boumans RM. 2002. A typology for the classification, description and valuation of ecosystem functions, goods and services. Ecol Econ 41: 393–408. [Google Scholar]
- Donaldson JE, Hui C, Richardson DM, Robertson MP, Webber BL, Wilson JR. 2014. Invasion trajectory of alien trees: the role of introduction pathway and planting history. Glob Change Biol 20: 1527–1537. [CrossRef] [Google Scholar]
- Donoghue MJ, Edwards EJ. 2014. Biome shifts and niche evolution in plants. Annu Rev Ecol Evol Syst 45: 547–572. [CrossRef] [Google Scholar]
- Early R, Sax DF. 2014. Climatic niche shifts between species' native and naturalized ranges raise concern for ecological forecasts during invasions and climate change. Glob Ecol Biogeogr 23: 1356–1365. [CrossRef] [Google Scholar]
- Fernández M, Hamilton H. 2015. Ecological niche transferability using invasive species as a case study. PLOS ONE 10: e0119891. [CrossRef] [MathSciNet] [PubMed] [Google Scholar]
- Grimaldo JT, Bini LM, Landeiro VL, et al. 2016. Spatial and environmental drivers of macrophyte diversity and community composition in temperate and tropical calcareous rivers. Aquat Bot 132: 49–61. [CrossRef] [Google Scholar]
- Guisan A, Petitpierre B, Broennimann O, Daehler C, Kueffer C. 2014. Unifying niche shift studies: insights from biological invasions. Trends Ecol Evol 29: 260–269. [CrossRef] [PubMed] [Google Scholar]
- Hussner A. 2012. Alien aquatic plant species in European countries. Weed Res 52: 297–306. [CrossRef] [Google Scholar]
- Kaufman SR, Kaufman W. 2013. Invasive plants: a guide to identification, impacts, and control of common North American species. US: Stackpole Books. [Google Scholar]
- Kelly R, Leach K, Cameron A, Maggs CA, Reid N. 2014. Combining global climate and regional landscape models to improve prediction of invasion risk. Divers Distrib 20: 884–894. [CrossRef] [Google Scholar]
- Kolanowska M. 2013. Niche conservatism and the future potential range of Epipactis helleborine (Orchidaceae). PLoS ONE 8: e77352. [CrossRef] [Google Scholar]
- Kueffer C, Daehler CC, Torres-Santana CW, et al. 2010. A global comparison of plant invasions on oceanic islands. Perspect Plant Ecol Evol Syst 12: 145–161. [CrossRef] [Google Scholar]
- Larson ER, Gallagher RV, Beaumont LJ, Olden JD. 2014. Generalized “avatar” niche shifts improve distribution models for invasive species. Divers Distrib 20: 1296–1306. [CrossRef] [Google Scholar]
- Leppäkoski E, Gollasch S, Olenin S. 2013. Invasive aquatic species of Europe. Distribution, impacts and management. Germany: Springer Science & Business Media. [Google Scholar]
- Lowe S, Browne M, Boudjelas S, De Poorter M. 2000. 100 of the world's worst invasive alien species: a selection from the global invasive species database. Auckland, New Zealand: Invasive Species Specialist Group. [Google Scholar]
- Luque GM, Bellard C, Bertelsmeier C, et al. 2014. The 100th of the world's worst invasive alien species. Biol. Invasions 16: 981–985. [CrossRef] [Google Scholar]
- Mainali KP, Warren DL, Dhileepan K, et al. 2015. Projecting future expansion of invasive species: comparing and improving methodologies for species distribution modeling. Glob Change Biol 21: 4464–4480. [CrossRef] [Google Scholar]
- Medley KA. 2010. Niche shifts during the global invasion of the Asian tiger mosquito, Aedes albopictus Skuse (Culicidae), revealed by reciprocal distribution models. Glob Ecol Biogeogr 19: 122–133. [CrossRef] [Google Scholar]
- Montecino V, Molina X, Kumar S, Castillo ML, Bustamante RO. 2014. Niche dynamics and potential geographic distribution of Didymosphenia geminata (Lyngbye) M. Schmidt, an invasive freshwater diatom in Southern Chile. Aquat Invasions 9: 507–519. [CrossRef] [Google Scholar]
- Natalie GK, Myla FJA. 2015. Invasion risk in a warmer world: modeling range expansion and habitat preferences of three nonnative aquatic invasive plants. Invasive Plant Sci Manag 8: 436–449. [CrossRef] [Google Scholar]
- Nunes AL, Tricarico E, Panov VE, Cardoso AC, Katsanevakis S. 2015. Pathways and gateways of freshwater invasions in Europe. Aquat Invasions 10: 359–370. [CrossRef] [Google Scholar]
- Oke OA, Thompson KA. 2015. Distribution models for mountain plant species: the value of elevation. Ecol Model 301: 72–77. [CrossRef] [Google Scholar]
- Petitpierre B, Kueffer C, Broennimann O, Randin C, Daehler C, Guisan A. 2012. Climatic niche shifts are rare among terrestrial plant invaders. Science 335: 1344–1348. [CrossRef] [PubMed] [Google Scholar]
- Phillips SJ, Anderson RP, Schapire RE. 2006. Maximum entropy modeling of species geographic distributions. Ecol Model 190: 231–259. [CrossRef] [Google Scholar]
- Riis T, Olesen B, Clayton JS, Lambertini C, Brix H, Sorrell BK. 2012. Growth and morphology in relation to temperature and light availability during the establishment of three invasive aquatic plant species. Aquat Bot 102: 56–64. [CrossRef] [Google Scholar]
- Rödder D, Engler JO. 2011. Quantitative metrics of overlaps in Grinnellian niches: advances and possible drawbacks. Glob Ecol Biogeogr 20: 915–927. [CrossRef] [Google Scholar]
- Svirčev ZB, Tokodi N, Drobac D, Codd GA. 2014. Cyanobacteria in aquatic ecosystems in Serbia: effects on water quality, human health and biodiversity. Syst Biodivers 12: 261–270. [CrossRef] [Google Scholar]
- Töpel M, Antonelli A, Yesson C, Eriksen B. 2012. Past climate change and plant evolution in western North America: a case study in Rosaceae. PLoS ONE 7: e50358. [CrossRef] [PubMed] [Google Scholar]
- Václavík T, Kupfer JA, Meentemeyer RK. 2012. Accounting for multi-scale spatial autocorrelation improves performance of invasive species distribution modelling (iSDM). J Biogeogr 39: 42–55. [CrossRef] [Google Scholar]
- Varela S, Anderson RP, García-Valdés R, Fernández-González F. 2014. Environmental filters reduce the effects of sampling bias and improve predictions of ecological niche models. Ecography 37: 1084–1091. [Google Scholar]
- Wan J, Wang C, Tan J, Yu F. 2017. Climatic niche divergence and habitat suitability of eight alien invasive weeds in china under climate change. Ecol Evol 7: 1541–1552. [CrossRef] [PubMed] [Google Scholar]
- Warfe DM, Pettit NE, Magierowski RH, et al. 2013. Hydrological connectivity structures concordant plant and animal assemblages according to niche rather than dispersal processes. Freshw Biol 58: 292–305. [CrossRef] [Google Scholar]
- Warren DL, Glor RE, Turelli M. 2008. Environmental niche equivalency versus conservatism: quantitative approaches to niche evolution. Evolution 62: 2868–2883. [CrossRef] [PubMed] [Google Scholar]
- Warren DL, Glor RE, Turelli M. 2010. ENMTools: a toolbox for comparative studies of environmental niche models. Ecography 33: 607–611. [Google Scholar]
- Wiens JJ, Graham CH. 2005. Niche conservatism: integrating evolution, ecology, and conservation biology. Annu Rev Ecol Evol Syst 36: 519–539. [CrossRef] [Google Scholar]
- Zhu G, Gao Y, Zhu L. 2013. Delimiting the coastal geographic background to predict potential distribution of Spartina alterniflora. Hydrobiologia 717: 177–187. [CrossRef] [Google Scholar]
Cite this article as: Wang C-J, Wan J-Z, Qu H, Zhang Z-X. 2017. Climatic niche shift of aquatic plant invaders between native and invasive ranges: a test using 10 species across different biomes on a global scale. Knowl. Manag. Aquat. Ecosyst., 418, 27.
All Tables
Number of occurrence localities, AUC values, and climatic niche overlap between native and invasive models for aquatic plant invaders (APIs). Native and invasive (the subscripts in this table) represent native and invasive models, respectively. Record represents the number of occurrence localities based on both native and invasive models, respectively. AUC represents the AUC values of MAXENT modeling based on the occurrence localities of native and invasive models, respectively. Dobs represents Schoener's D for APIs between native and invasive models and Dnull represents Schoener's D outside of the 95% confidence limits for each API based on the null model. Dobs values smaller than Dnull significantly support niche shift. VS NA and VS IN (the subscripts in this table) represent niche overlap between all models and the native models (or invasive models). The code of I was similar to D. Bold values represent significant climatic niche shift between native and invasive ranges based on the null model. SD, standard deviation.
Summary of climatic suitability and niche overlap for all 10 aquatic plant invaders (APIs) in all 12 freshwater biomes. Numerical data is represented as mean ± SD; D represents Schoener's D for APIs between native and invasive models on both native and invasive ranges; I represents a measure derived from the Hellinger distance and is called I based on both the native and invasive ranges; the biome codes are identical to those in Figure 1. The invasive model is based on the distribution records of invasive ranges and the native model is based on the distribution records of native ranges. Bold values represent significant differences between native and invasive models based on the null model. SD, standard deviation.
All Figures
|
Fig. 1 Global distribution of freshwater biomes. Codes: 1, large lakes; 2, large river deltas; 3, montane freshwaters; 4, oceanic islands; 5, polar freshwaters; 6, temperate coastal rivers; 7, temperate floodplain rivers and wetlands; 8, temperate upland rivers; 9, tropical and subtropical coastal rivers; 10, tropical and subtropical floodplain rivers and wetland complexes; 11, tropical and subtropical upland rivers; 12, xeric freshwaters and endorheic (closed) basins. |
| In the text | |
|
Fig. 2 Climatic space of aquatic plant invaders based on principal component analysis. Red points represent occurrence records of native regions, while blue points represent occurrence records of invasive regions. |
| In the text | |
|
Fig. 3 Map of climatic suitability of Najas minor for native (a) and invasive models (b). |
| In the text | |
Current usage metrics show cumulative count of Article Views (full-text article views including HTML views, PDF and ePub downloads, according to the available data) and Abstracts Views on Vision4Press platform.
Data correspond to usage on the plateform after 2015. The current usage metrics is available 48-96 hours after online publication and is updated daily on week days.
Initial download of the metrics may take a while.