Fig. 3
Download original image
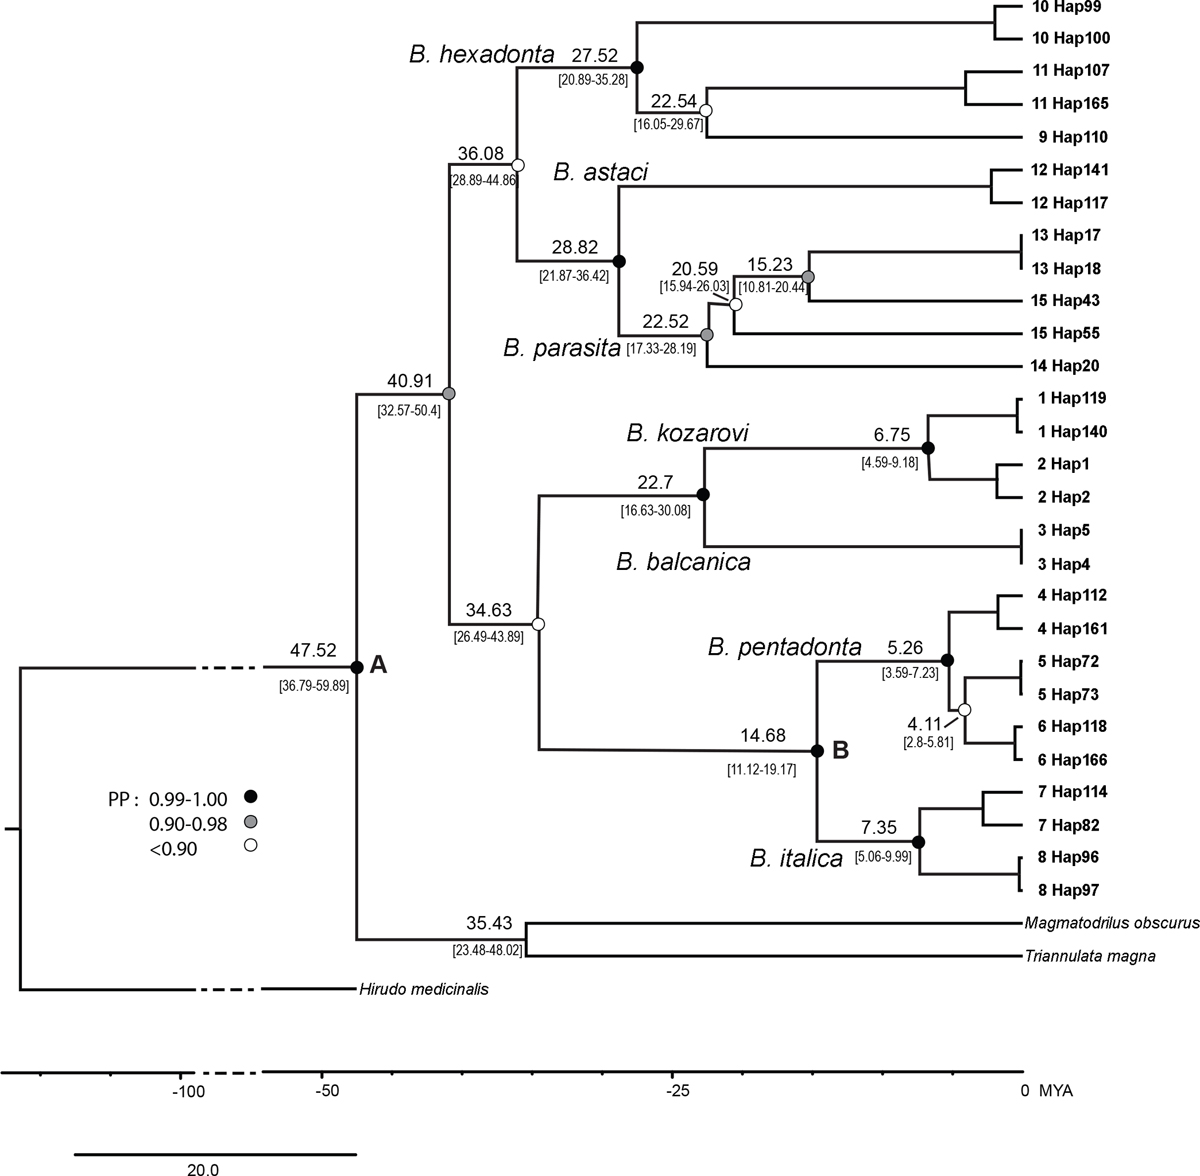
Time-calibrated Bayesian phylogenetic tree inferred from mitochondrial COI sequences. The divergence times are depicted as median values and 95% HPD intervals. Circles on nodes represent clade support (Bayesian posterior probabilities, PP) as shown in the figure. 15 groups revealed by species delimitation are shown as well as employed haplotypes (details are provided in Tab. S1). Further, the names of branchiobdellid species are provided next to branches. Nodes A and B represent calibration points: A – the split of North American and European Astacids, and B – the split of Au. torrentium and Au. pallipes s.l.
Current usage metrics show cumulative count of Article Views (full-text article views including HTML views, PDF and ePub downloads, according to the available data) and Abstracts Views on Vision4Press platform.
Data correspond to usage on the plateform after 2015. The current usage metrics is available 48-96 hours after online publication and is updated daily on week days.
Initial download of the metrics may take a while.