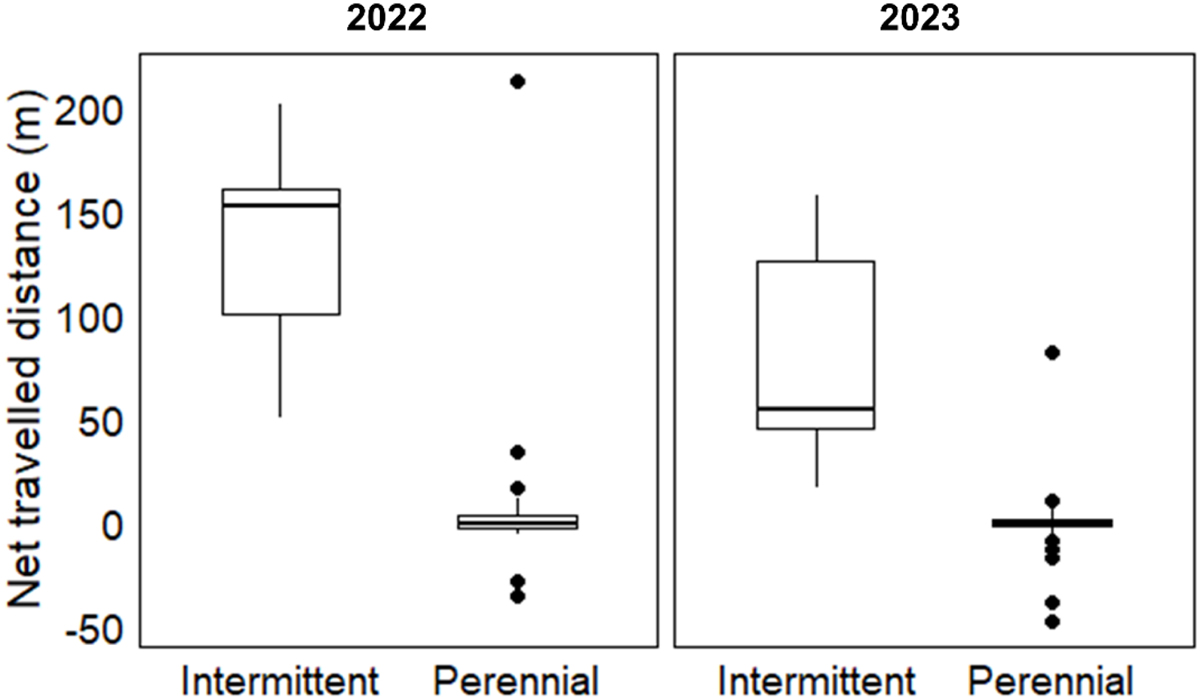
Fig. 4
Download original image
Boxplot comparisons of the net travelled distance for Intermittent (n2022 = 8; n2023 = 13) and Perennial (n2022 = 31; n2023 = 33) T. muticellus in 2022 and 2023, with the box representing the interquartile ranges (IQR), whiskers indicating the data ranges, and horizontal lines denoting the median values.
Current usage metrics show cumulative count of Article Views (full-text article views including HTML views, PDF and ePub downloads, according to the available data) and Abstracts Views on Vision4Press platform.
Data correspond to usage on the plateform after 2015. The current usage metrics is available 48-96 hours after online publication and is updated daily on week days.
Initial download of the metrics may take a while.