Fig. 3
Download original image
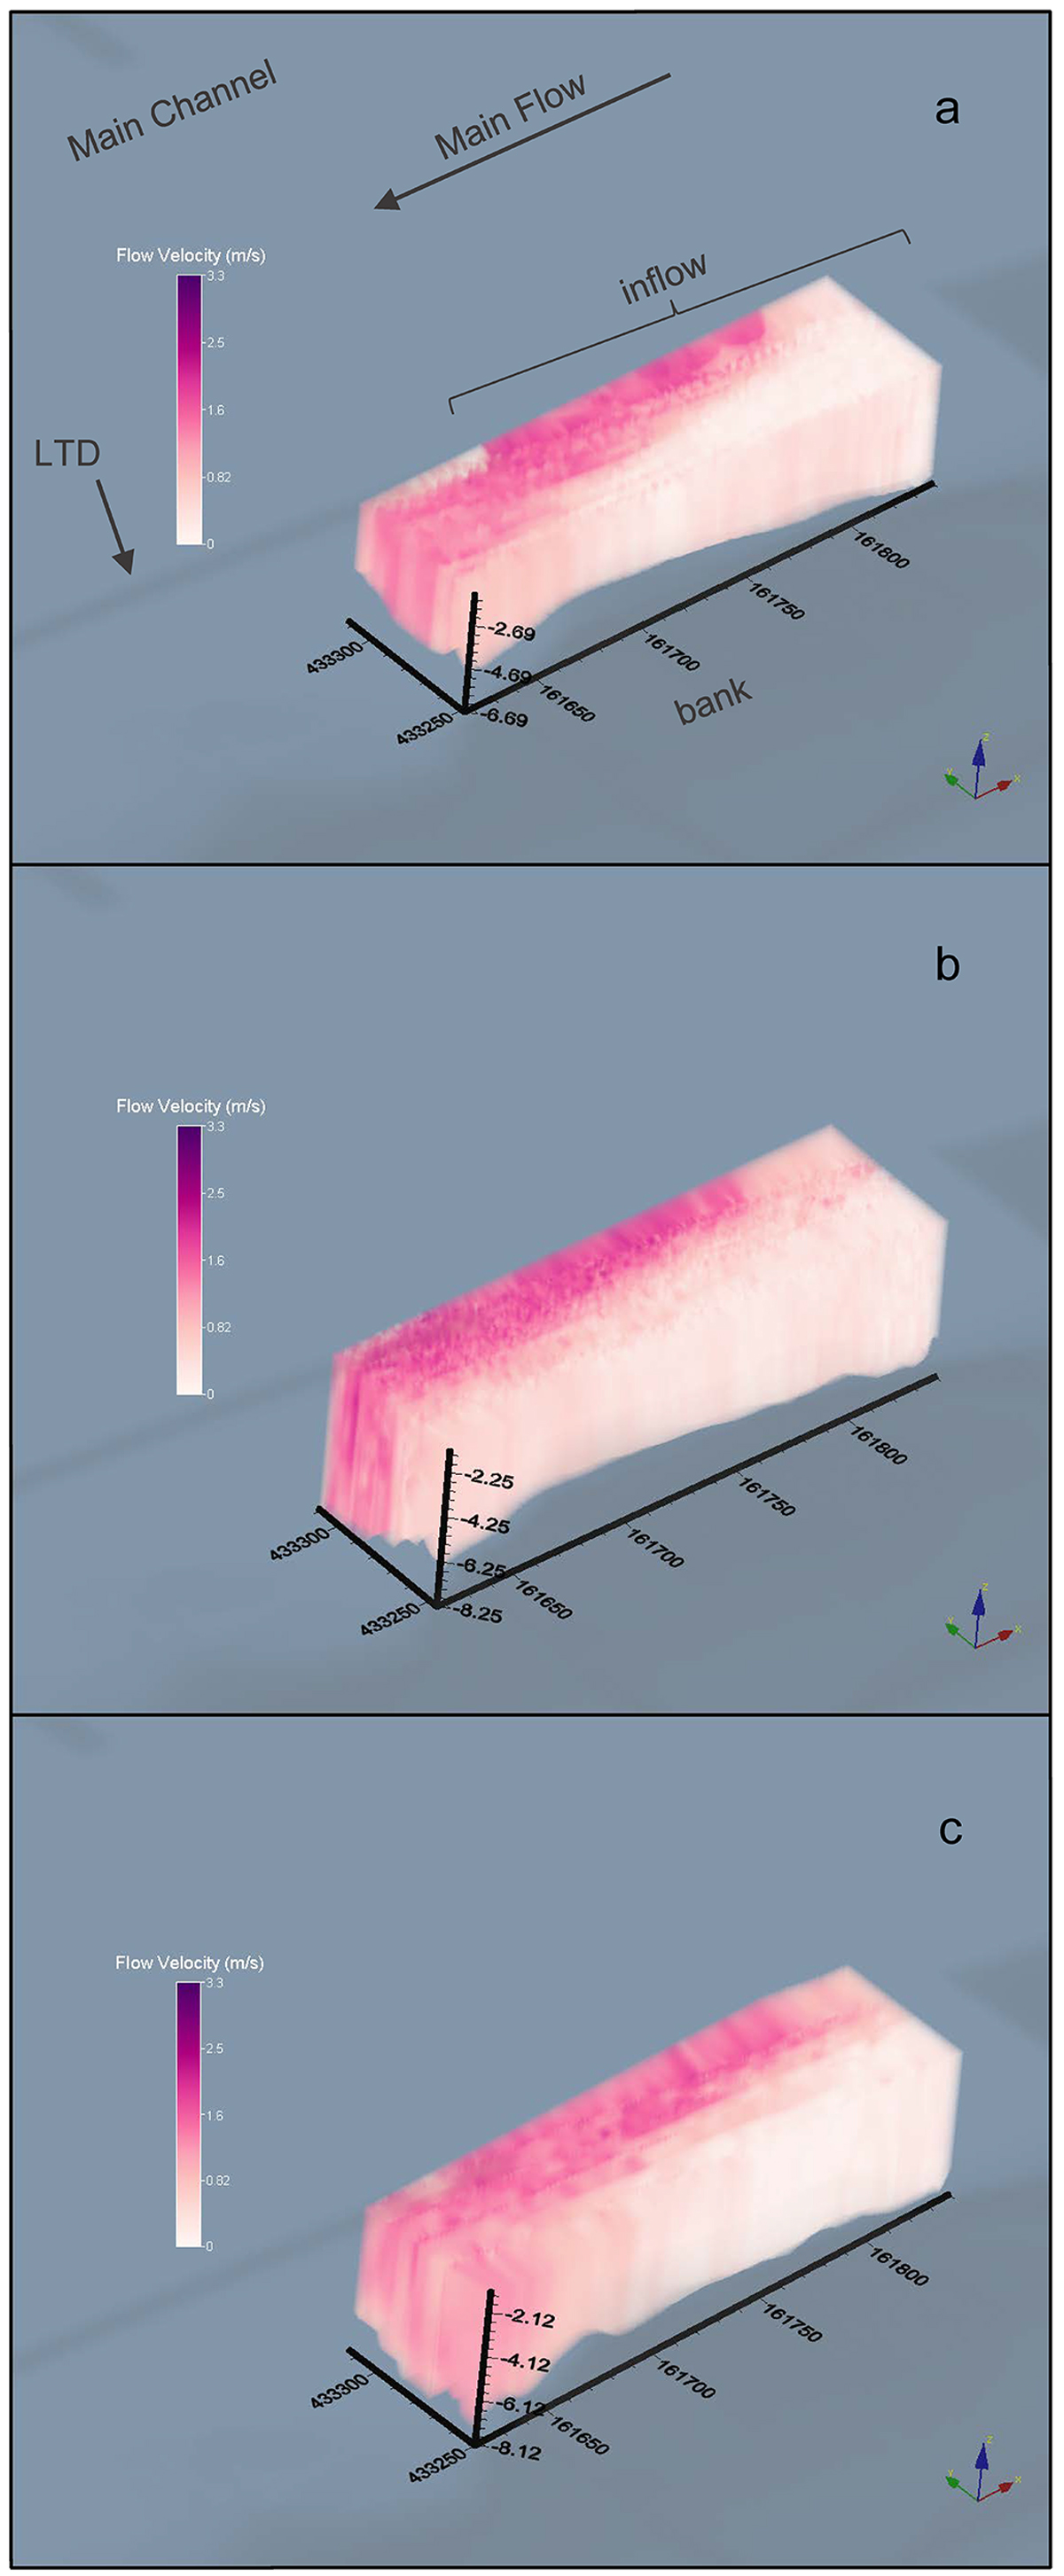
The 3D lattices of the gridded flow velocities (m/s; 2 significant figures) for the Wamel shore channel inflow from ADCP data collected in (a) December 2017, (b) February 2018 and (c) March 2019. The x, y and z orientations are indicated by the arrows on the bottom-left corners.
Current usage metrics show cumulative count of Article Views (full-text article views including HTML views, PDF and ePub downloads, according to the available data) and Abstracts Views on Vision4Press platform.
Data correspond to usage on the plateform after 2015. The current usage metrics is available 48-96 hours after online publication and is updated daily on week days.
Initial download of the metrics may take a while.