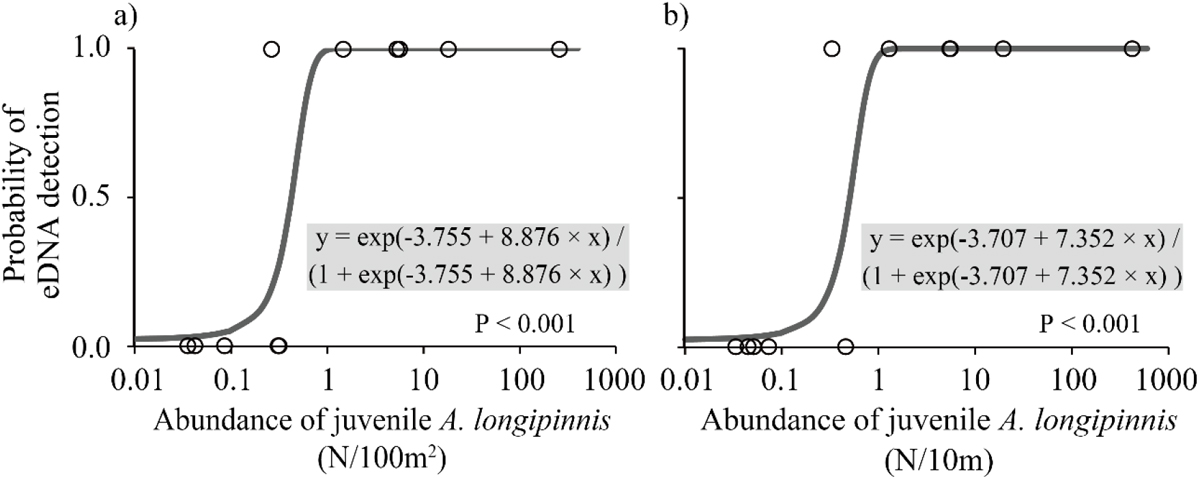
Fig. 3

Download original image
Probability of eDNA detection for the abundance of juvenile A. longipinnis per unit area (a) and perimeter (b). Plots with 0 abundance are not represented, because the x-axis is displayed in logarithmic form, although 0 abundance data were used in building the models and drawing these figures. Statistically significant models are indicated by solid lines and formulae. P-values based on likelihood ratio test are also shown.
Current usage metrics show cumulative count of Article Views (full-text article views including HTML views, PDF and ePub downloads, according to the available data) and Abstracts Views on Vision4Press platform.
Data correspond to usage on the plateform after 2015. The current usage metrics is available 48-96 hours after online publication and is updated daily on week days.
Initial download of the metrics may take a while.


