Fig. 1
Download original image
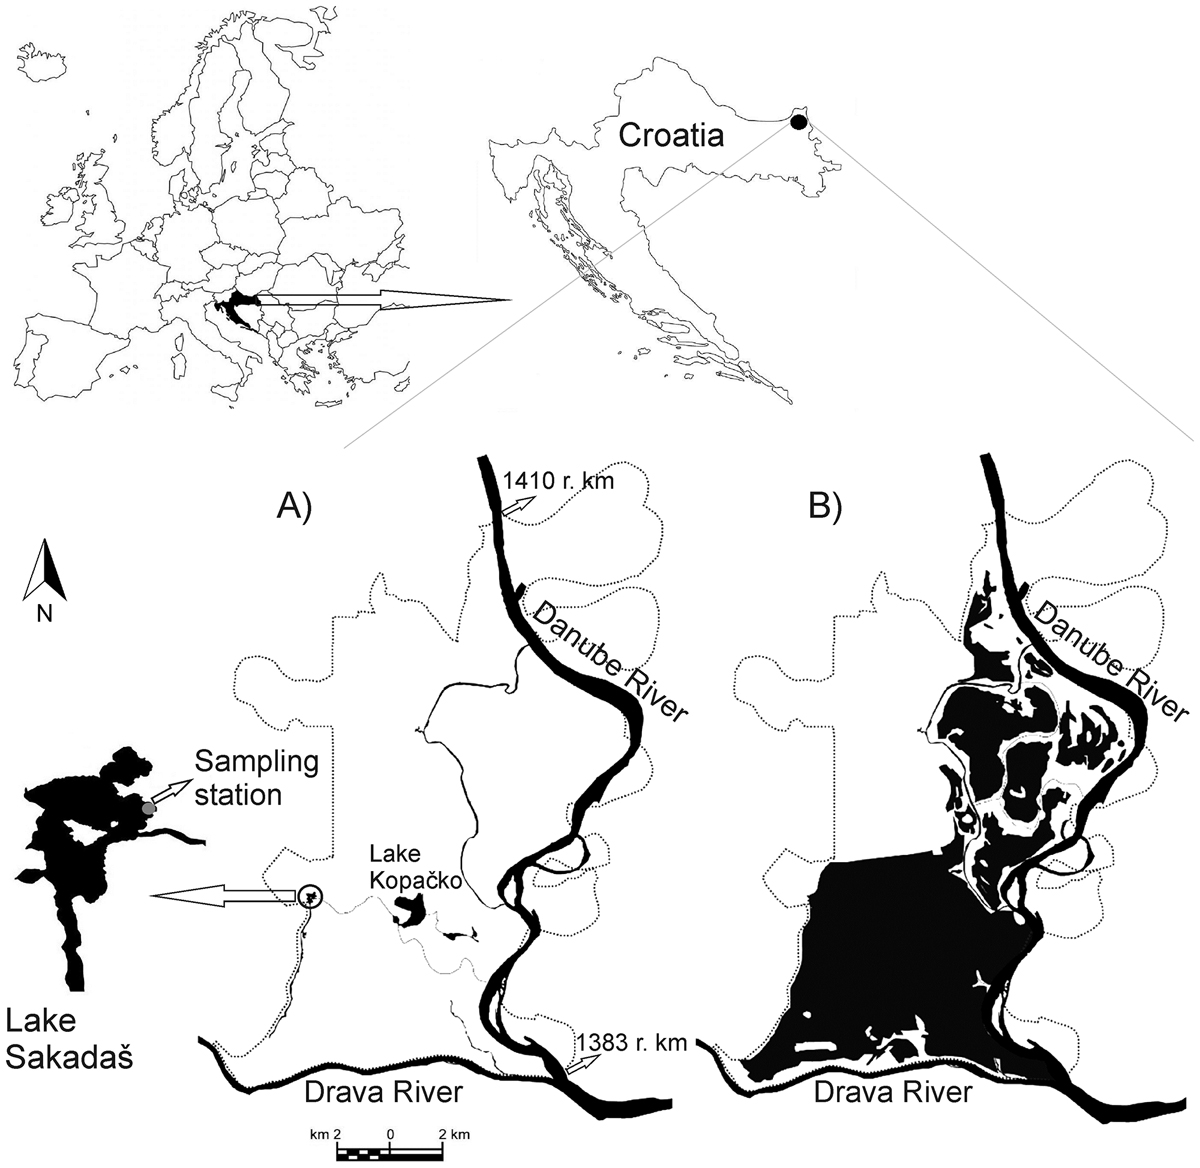
Map of the Kopački Rit floodplain (floodplain location in the north-east of Croatia is marked with a black dot) during (A) low-water period (Danube water level between 1 and 1.5 m) and (B) high-water period (Danube water level around 5 m) (maps of the floodplain area are modified from Schwarz (2005) and Mihaljević and Stević (2011)). Dotted line represents the border of the floodplain area. Study area (Lake Sakadaš) is located in the western part of the floodplain. The sampling station in the lake is marked with a grey dot.
Current usage metrics show cumulative count of Article Views (full-text article views including HTML views, PDF and ePub downloads, according to the available data) and Abstracts Views on Vision4Press platform.
Data correspond to usage on the plateform after 2015. The current usage metrics is available 48-96 hours after online publication and is updated daily on week days.
Initial download of the metrics may take a while.