Fig. 1
Download original image
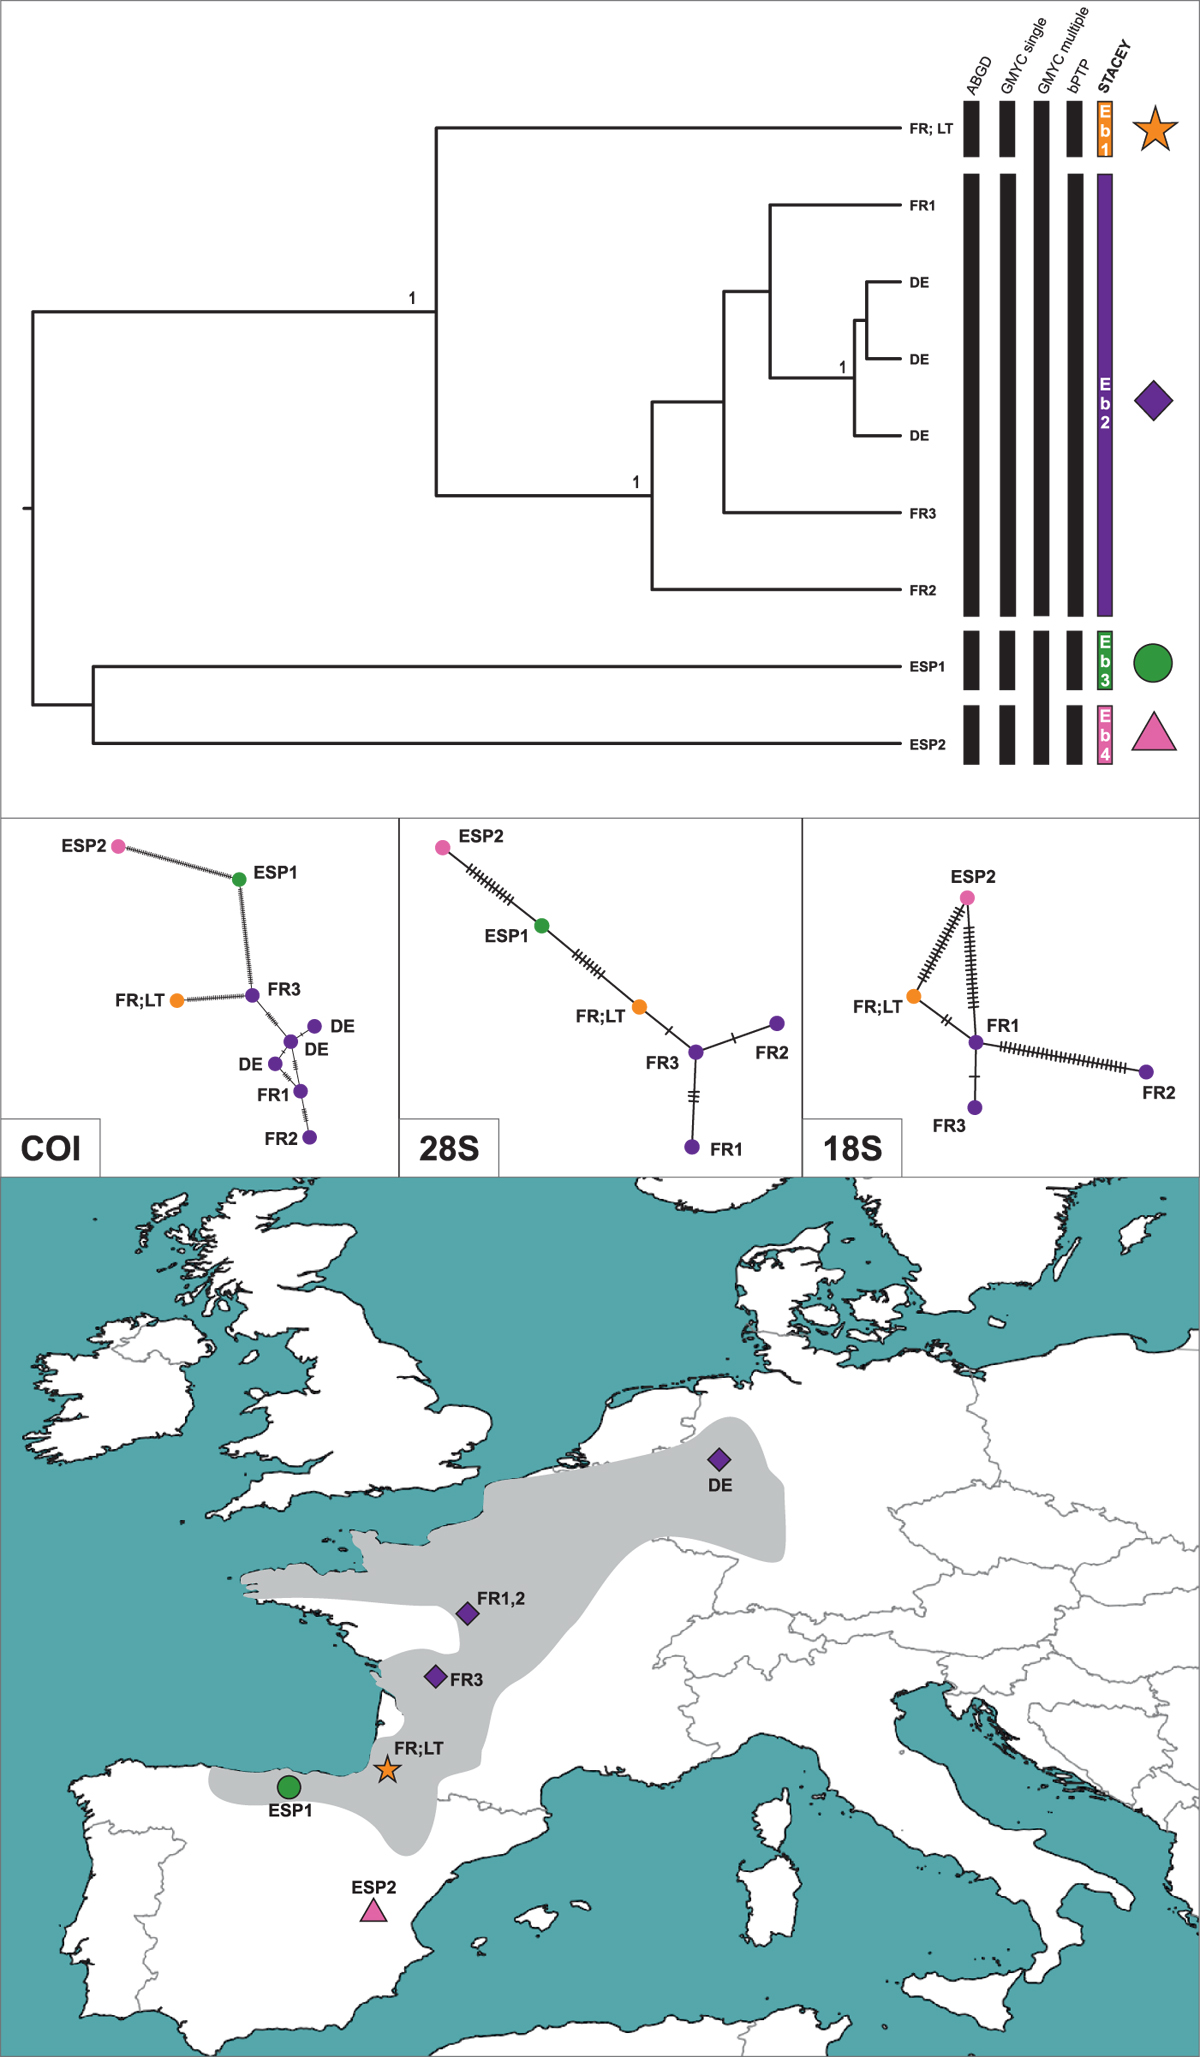
Maximum clade credibility tree of the Echinogammarus berilloni mined from NCBI GenBank, obtained from STACEY multilocus species delimitation analysis. Phylogeny was inferred from sequences of the mitochondrial COI and nuclear: 28S rRNA and 18S rRNA markers. The numbers by respective nodes indicate Bayesian posterior probability values = 1. The rows of respective bars represent the delimitation of molecular operational taxonomic units (MOTU) by various methods of species delimitation. The coloured symbols on the map represent STACEY-delimited MOTUs. The minimum spanning haplotype networks were generated using POPART software. The grey area on the map reflects known distribution range of E. berilloni. The star symbol corresponds to the individual collected in species' locus typicus (marked with ‘LT’ on phylogenetic tree). The map was generated using QGIS 2.18.3 (https://www.qgis.org/en/site/).
Current usage metrics show cumulative count of Article Views (full-text article views including HTML views, PDF and ePub downloads, according to the available data) and Abstracts Views on Vision4Press platform.
Data correspond to usage on the plateform after 2015. The current usage metrics is available 48-96 hours after online publication and is updated daily on week days.
Initial download of the metrics may take a while.