Appendix 3
Download original image
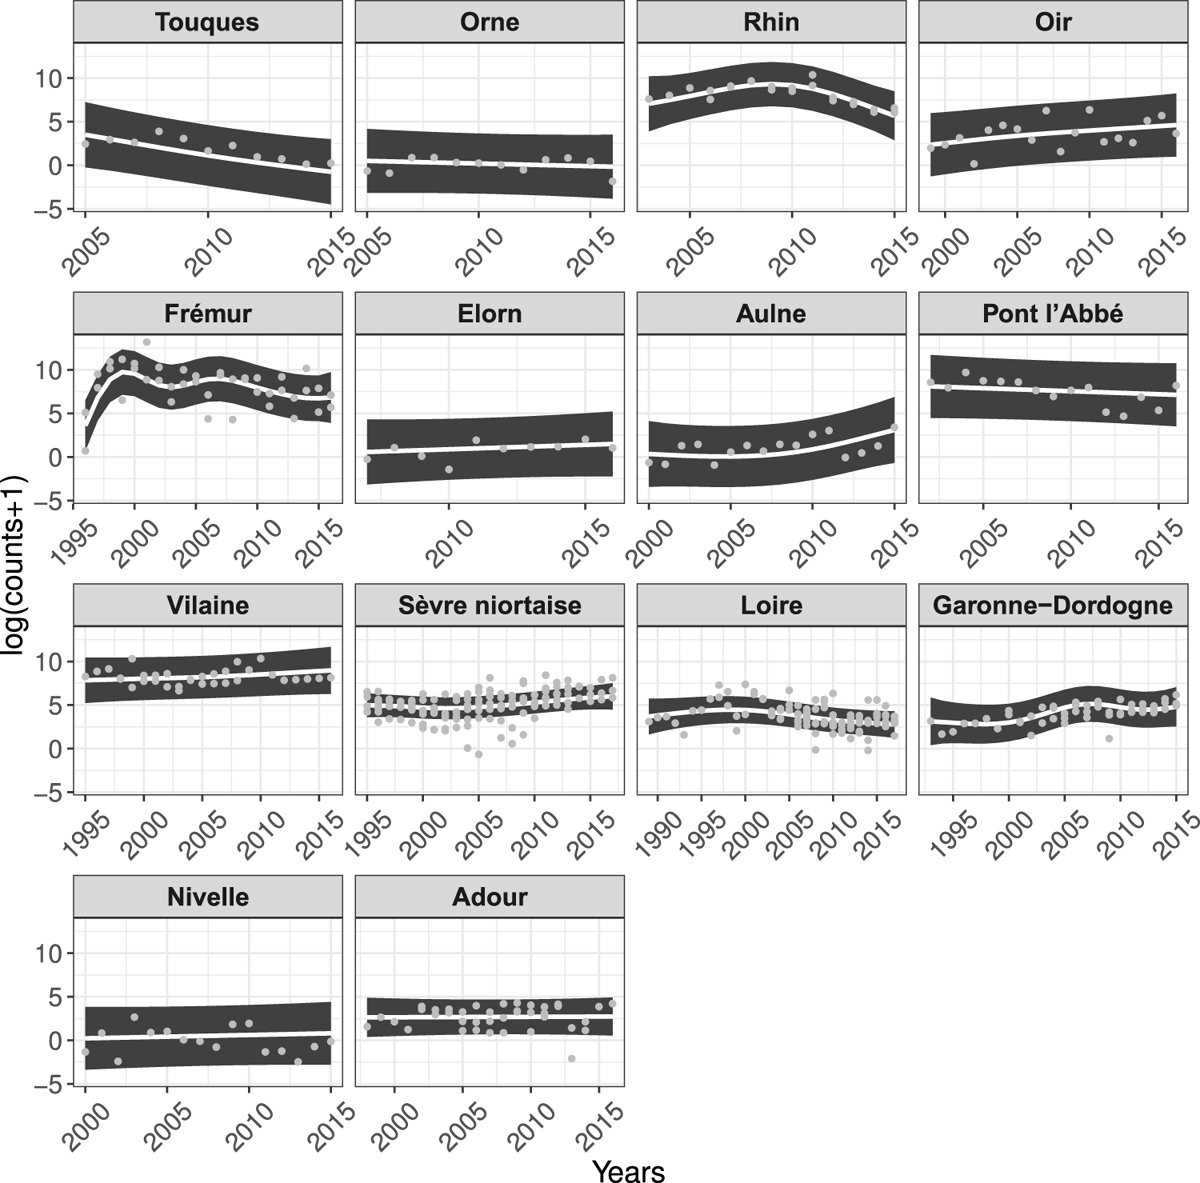
Change in fish counts (log(counts+1)) of Anguilla anguilla over the study period and for the 14 catchments with counts for this species. Catchments are ordered by latitude from north to south. Grey points represent predictions +/− residuals. White curves are the predicted values of the model and grey ribbons the 95% confidence intervals. The model explains 87% of the observed deviance.
Current usage metrics show cumulative count of Article Views (full-text article views including HTML views, PDF and ePub downloads, according to the available data) and Abstracts Views on Vision4Press platform.
Data correspond to usage on the plateform after 2015. The current usage metrics is available 48-96 hours after online publication and is updated daily on week days.
Initial download of the metrics may take a while.