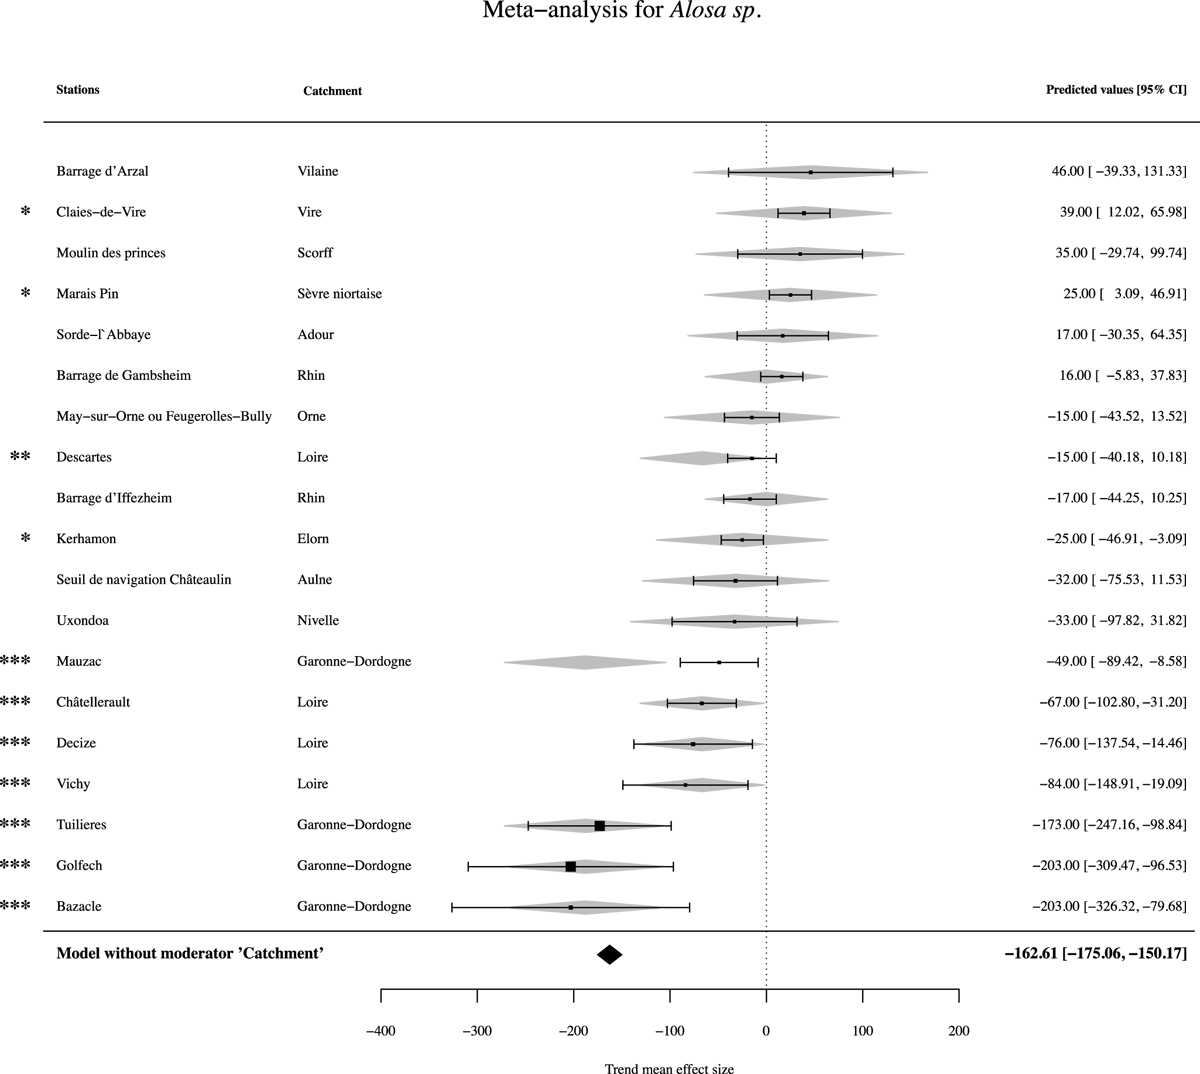
Fig. 3
Download original image
Trend in annual fish counts of Alosa spp. (black squares) for each monitoring station and 95% confidence intervals (whiskers). The size of the black squares is proportional to the weight of each station (i.e., the sum of counts over the study period) in the analysis. When the black square is located on the left side of the zero vertical line, the trend is declining. When it is located on the right side, the trend is increasing. Grey diamonds display the effect of the moderator ‘Catchment’. The black diamond at the bottom indicates the overall mean effect size for all the stations; * highlights a significant trend for the station (when the whiskers do not intersect the zero vertical line); ** highlights a significant trend for the catchment (when the grey diamond does not intersect the zero vertical line), but not for the station; *** highlights a significant trend for both the station and the catchment.
Current usage metrics show cumulative count of Article Views (full-text article views including HTML views, PDF and ePub downloads, according to the available data) and Abstracts Views on Vision4Press platform.
Data correspond to usage on the plateform after 2015. The current usage metrics is available 48-96 hours after online publication and is updated daily on week days.
Initial download of the metrics may take a while.