Open Access
Fig. 1
Download original image
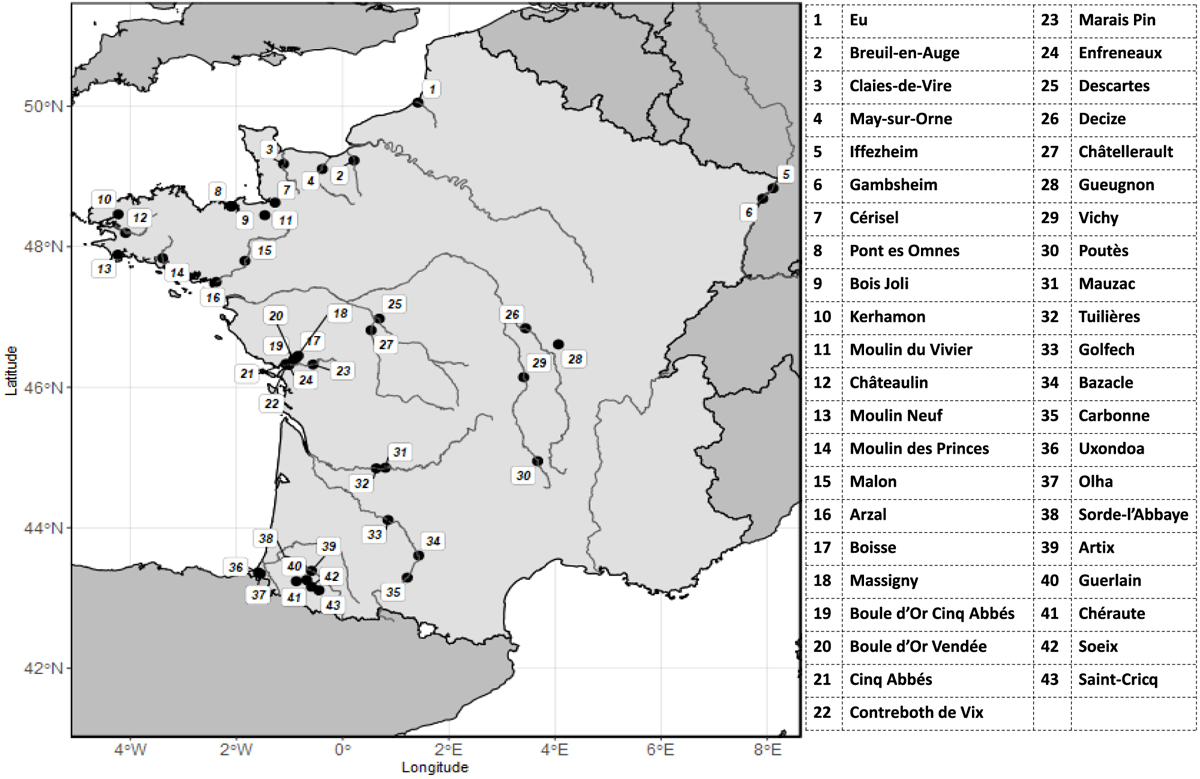
Location of the 43 long-term monitoring stations. Numbers identify each station and refer to the full name in the table. Stations are ordered by mean latitude of the catchment they belong to and from north to south.
Current usage metrics show cumulative count of Article Views (full-text article views including HTML views, PDF and ePub downloads, according to the available data) and Abstracts Views on Vision4Press platform.
Data correspond to usage on the plateform after 2015. The current usage metrics is available 48-96 hours after online publication and is updated daily on week days.
Initial download of the metrics may take a while.