Fig. 4
Download original image
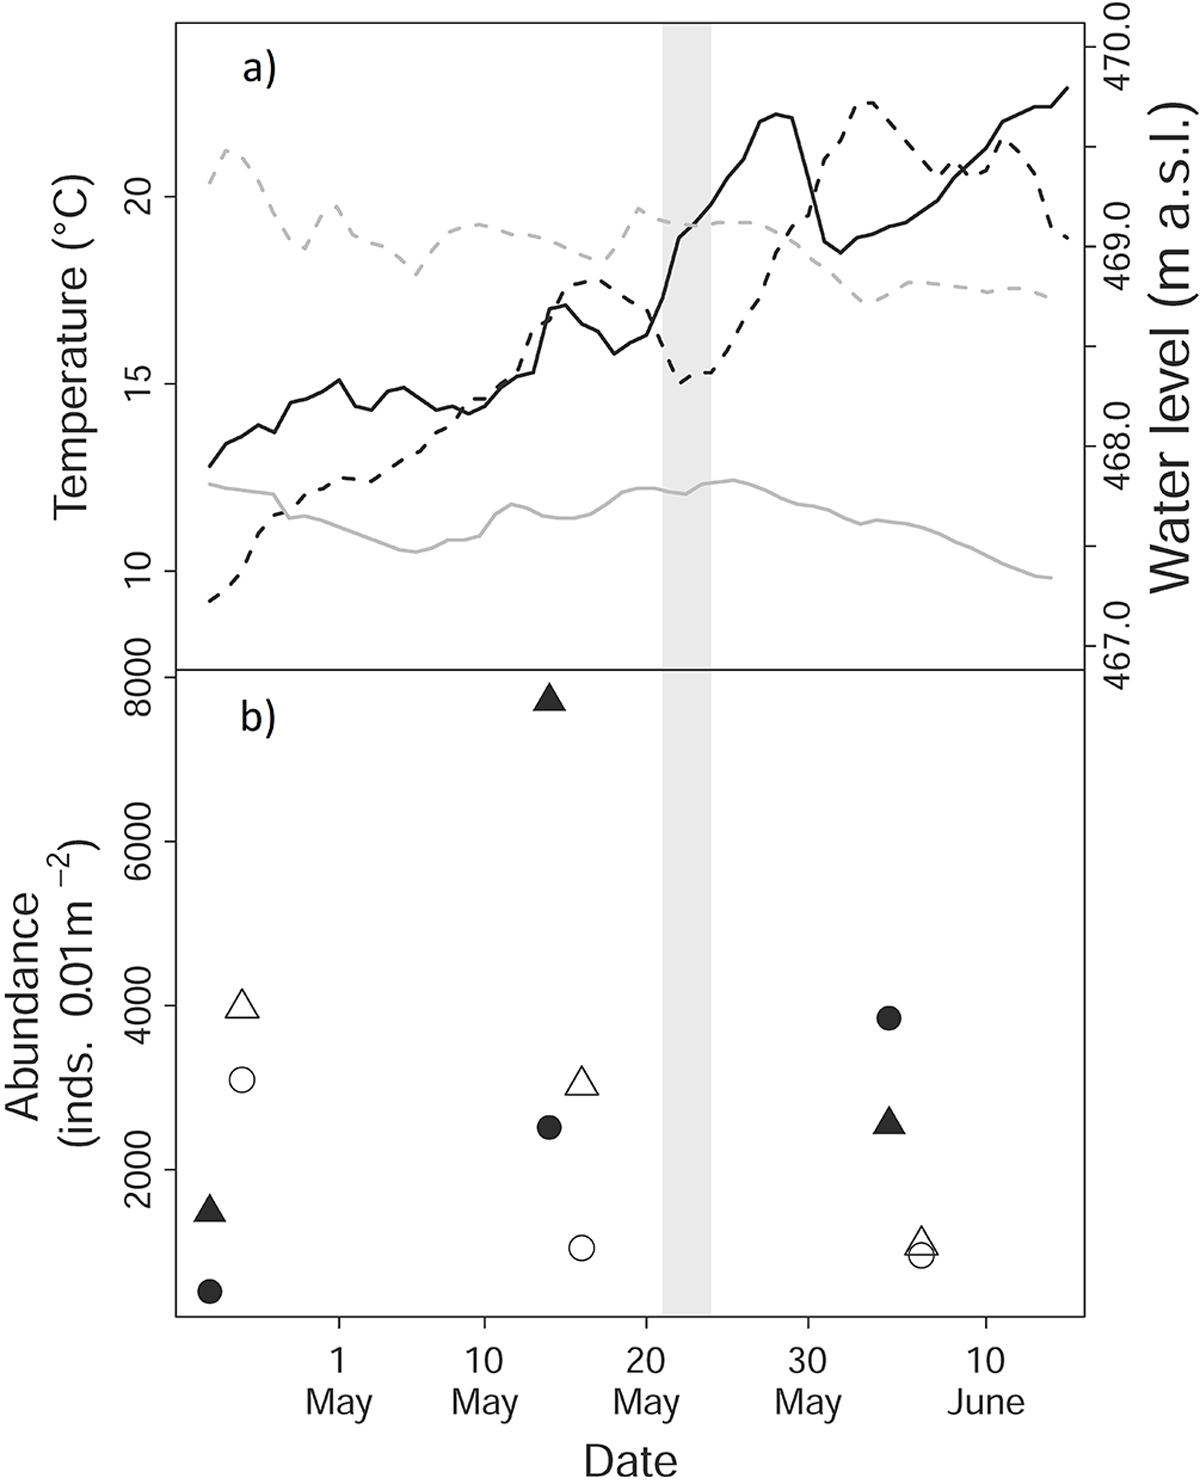
(a) Temperature (continuous black line in 2007 and dashed in 2008), and water level (continuous grey line in 2007 and dashed in 2008) and (b) abundance of Cladocera (circles) and Copepoda (triangles) in 2007 (empty symbols) and 2008 (black symbols) during the 0+ Sander lucioperca sampling period. The grey bar indicates the period of 0+ S. lucioperca cohort collapse in 2007.
Current usage metrics show cumulative count of Article Views (full-text article views including HTML views, PDF and ePub downloads, according to the available data) and Abstracts Views on Vision4Press platform.
Data correspond to usage on the plateform after 2015. The current usage metrics is available 48-96 hours after online publication and is updated daily on week days.
Initial download of the metrics may take a while.