Fig. 1
Download original image
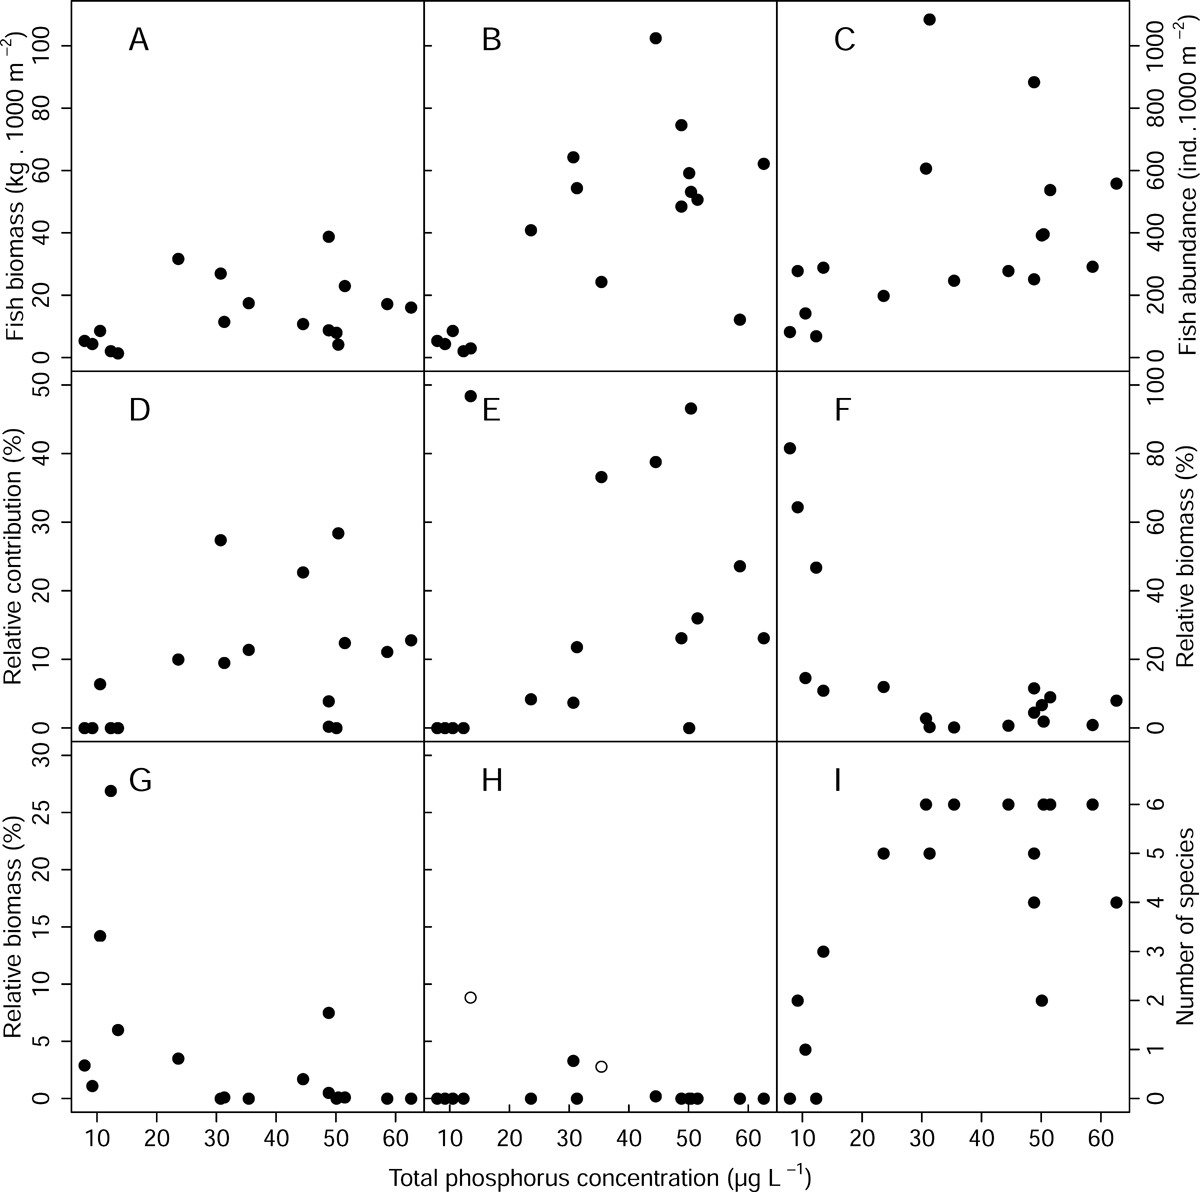
Relationships between fish indicators and total phosphorus concentration. First two columns share y-axis. A = total fish biomass in dam part, B = total fish biomass in tributary part, C = total fish abundance, D = relative biomass of common bream, E = relative abundance of ruffe, F = relative biomass of European perch, G = relative biomass of rudd, H = relative biomass of Salmonidae (black circles reservoirs < 700 m a s l and empty circles ≥ 700 m a s l), I = presence of 0+ fish of six species.
Current usage metrics show cumulative count of Article Views (full-text article views including HTML views, PDF and ePub downloads, according to the available data) and Abstracts Views on Vision4Press platform.
Data correspond to usage on the plateform after 2015. The current usage metrics is available 48-96 hours after online publication and is updated daily on week days.
Initial download of the metrics may take a while.