Open Access
Fig. 3
Download original image
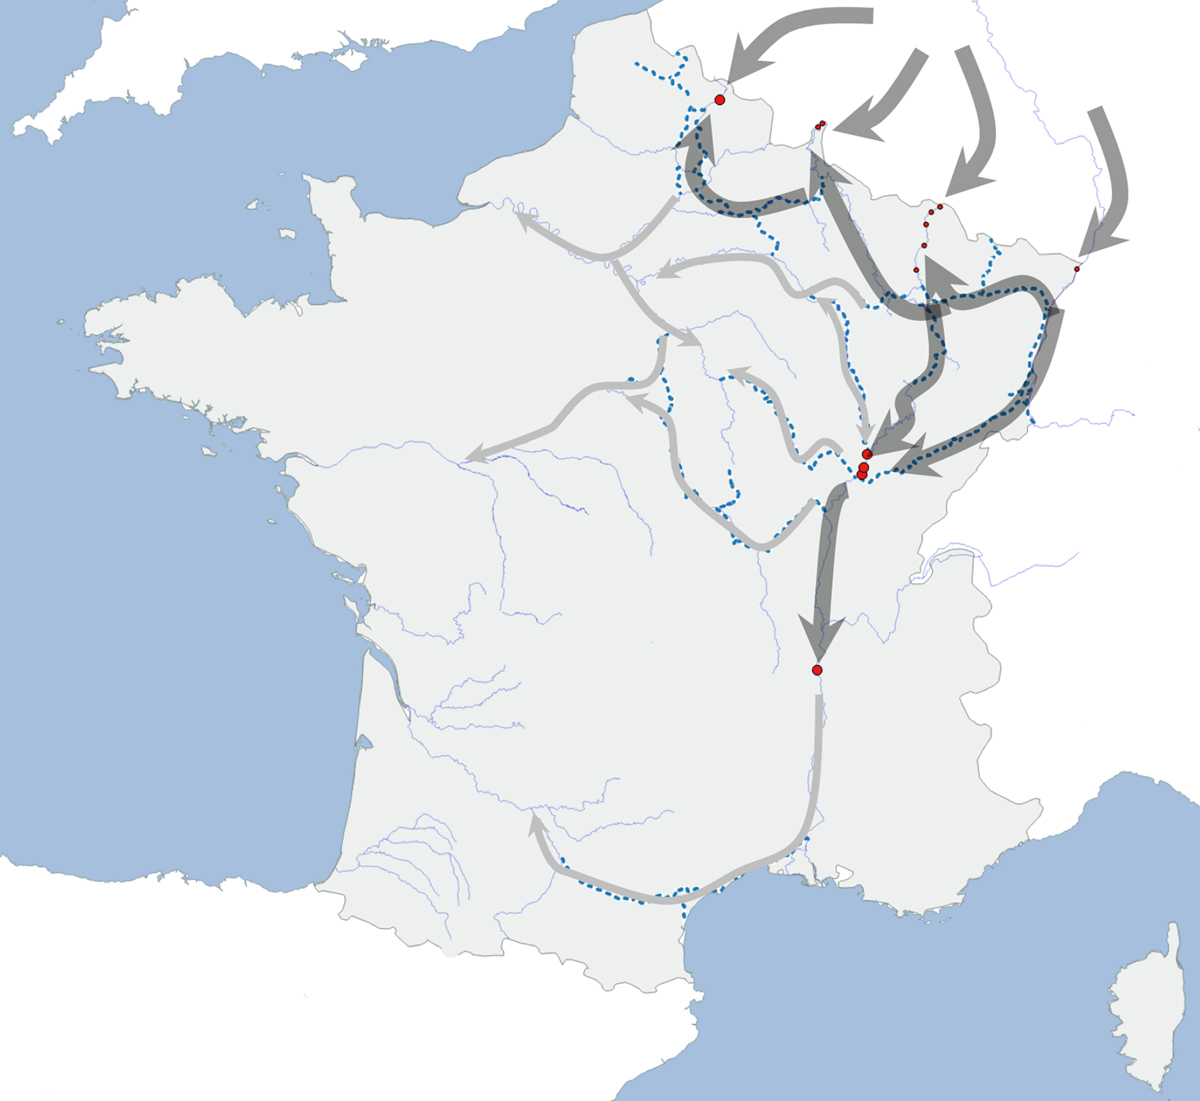
Potential past and future expansion corridors. Blue lines: main French rivers; blue dotted lines: canals; small dots: data before 2014; large dots: data after 2014; large arrows: possible past expansion ways; thin arrows: possible future expansion ways.
Current usage metrics show cumulative count of Article Views (full-text article views including HTML views, PDF and ePub downloads, according to the available data) and Abstracts Views on Vision4Press platform.
Data correspond to usage on the plateform after 2015. The current usage metrics is available 48-96 hours after online publication and is updated daily on week days.
Initial download of the metrics may take a while.