Fig. 4
Download original image
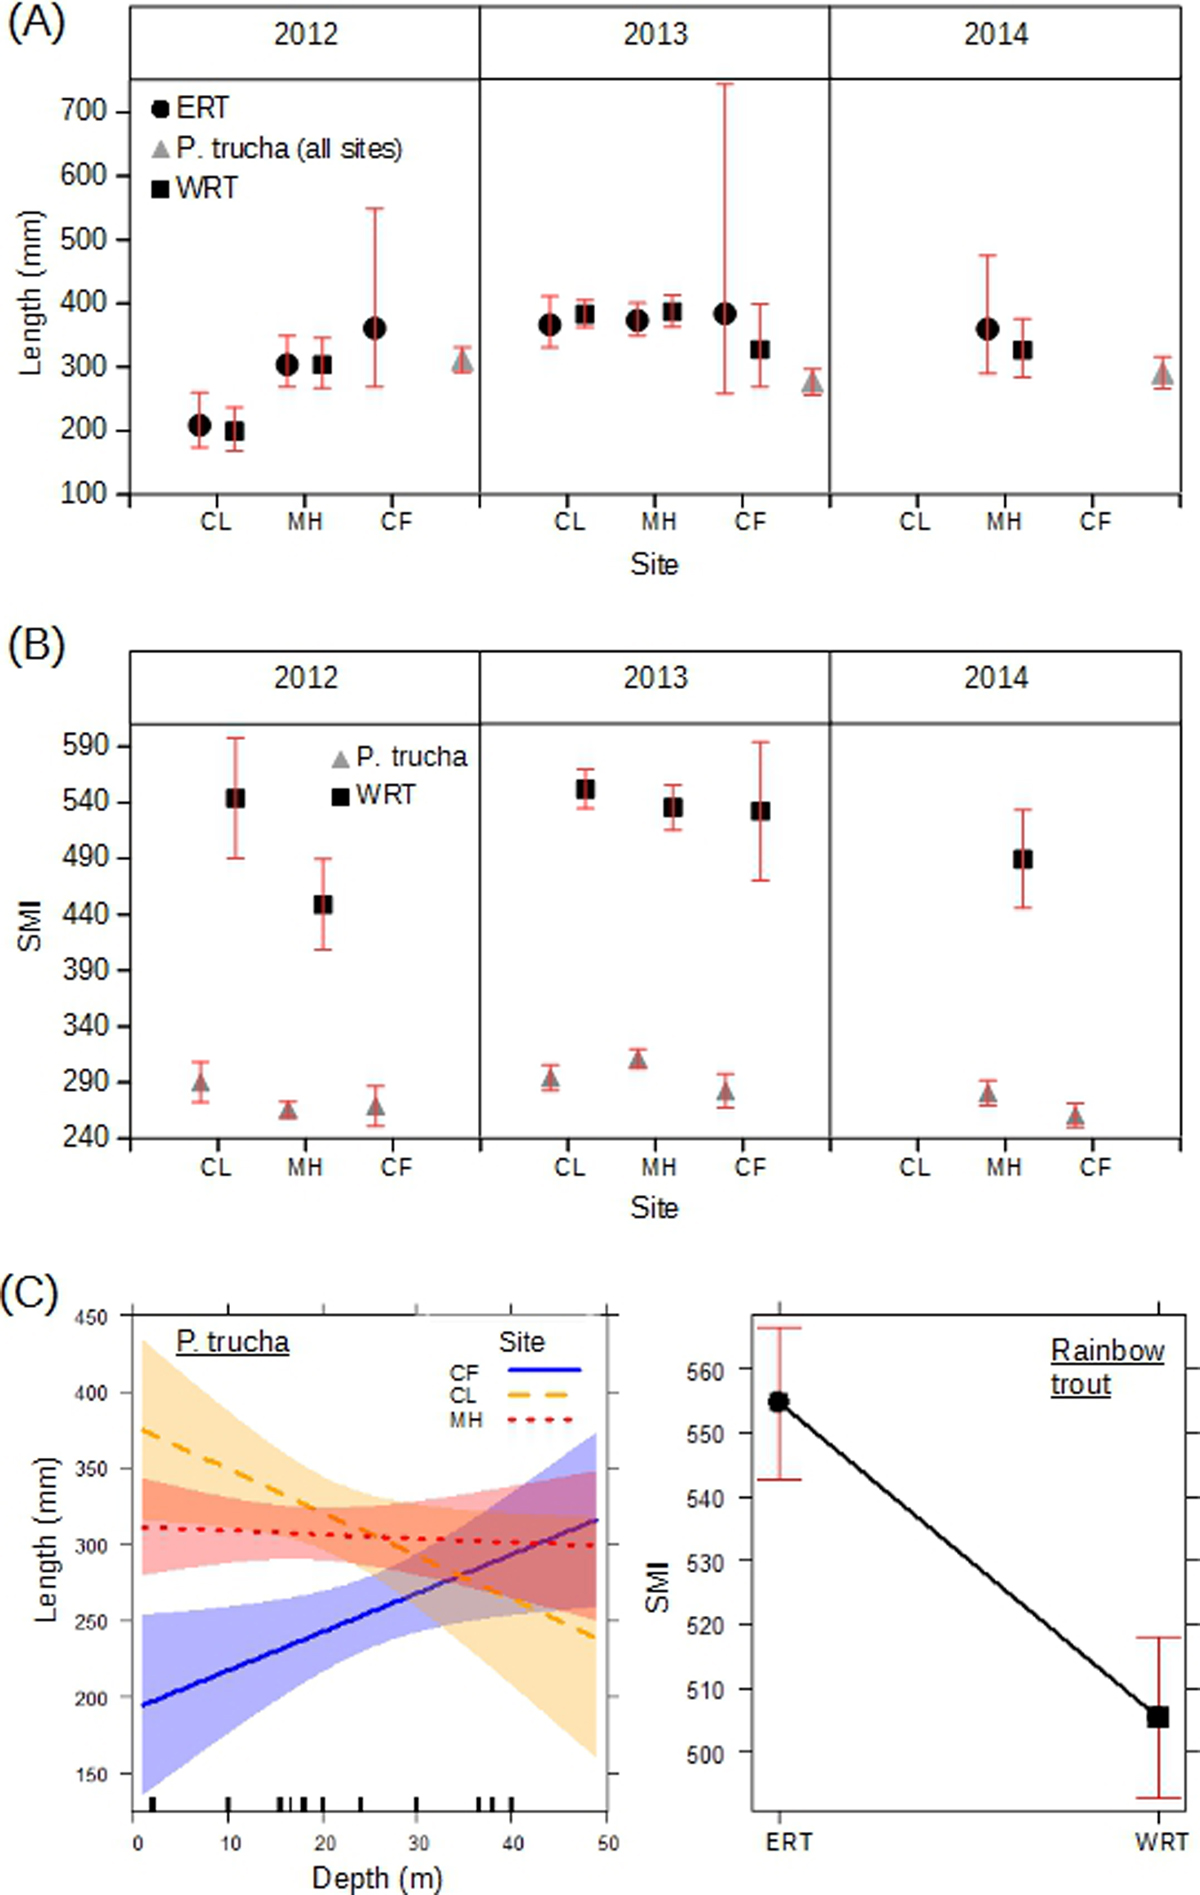
GLM estimates of (A) length vs. site by year for ERT, WRT, and Percichthys trucha, the latter with sites not differentiated (factor not present in its final model), (B) SMI vs. site by year for WRT and P. trucha, and (C) length vs. depth by site for P. trucha and SMI vs. origin of rainbow trout (escaped/wild). Bars and ribbons represent 95% confidence intervals. Additional ticks indicate sampling depths.
Current usage metrics show cumulative count of Article Views (full-text article views including HTML views, PDF and ePub downloads, according to the available data) and Abstracts Views on Vision4Press platform.
Data correspond to usage on the plateform after 2015. The current usage metrics is available 48-96 hours after online publication and is updated daily on week days.
Initial download of the metrics may take a while.