Fig. 3
Download original image
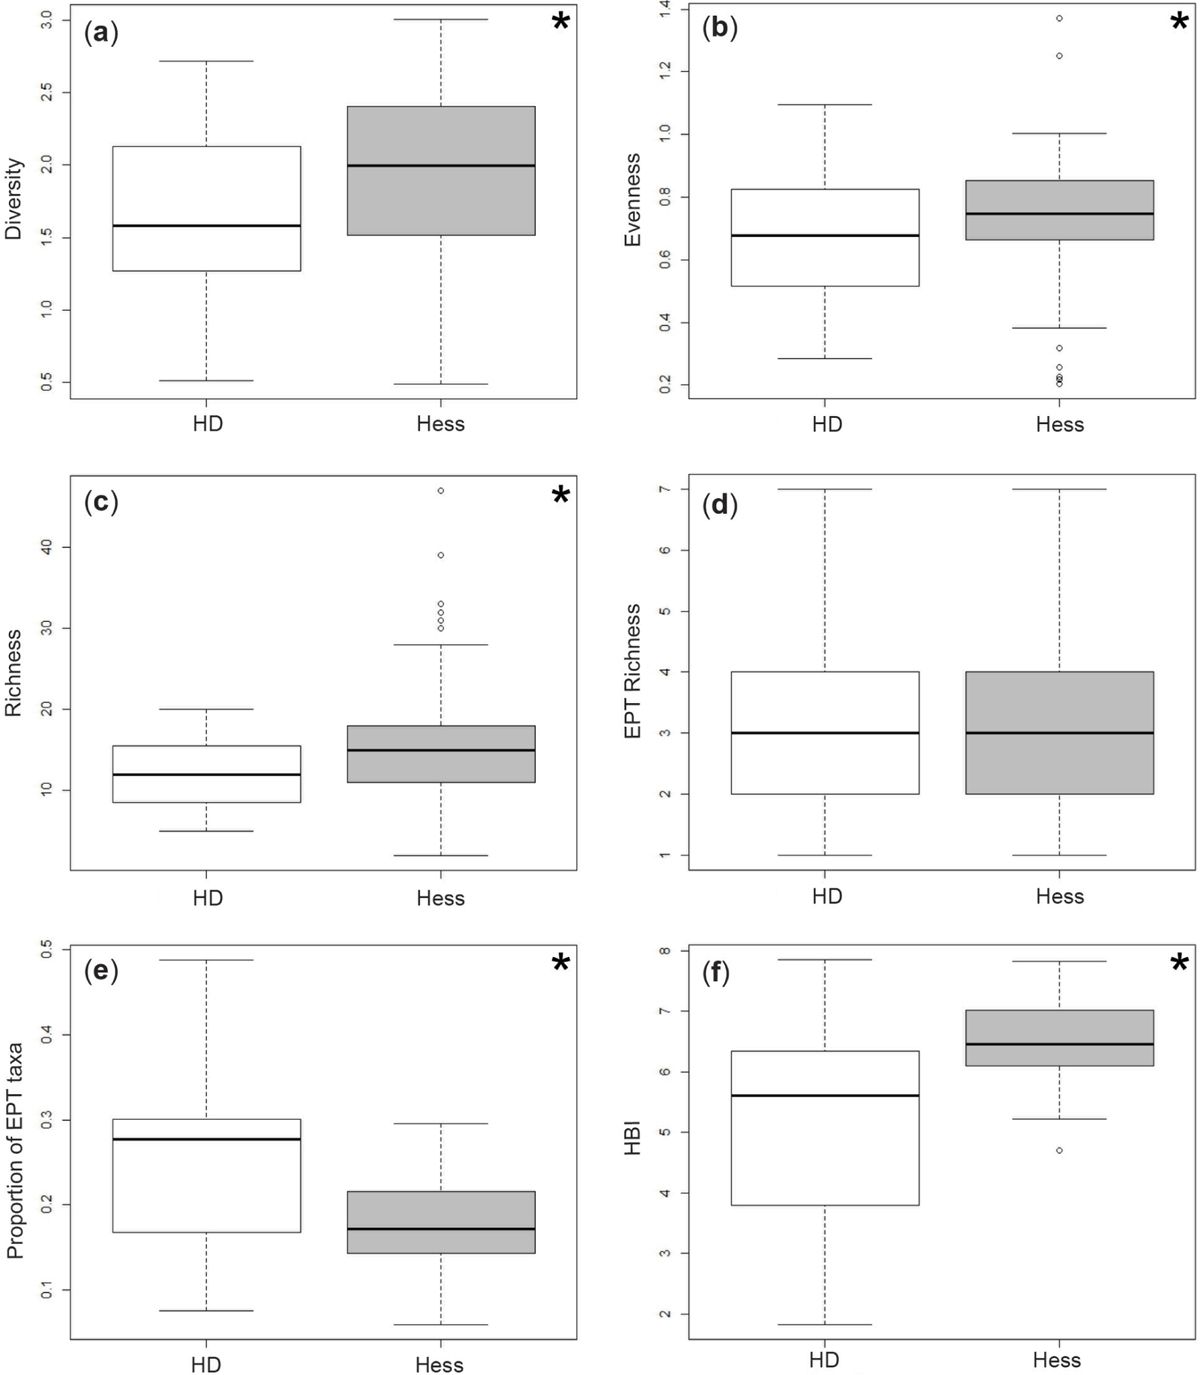
(a) Diversity, (b) evenness, (c) richness, (d) Ephemeroptera, Plecoptera and Trichoptera (EPT) richness, (e) proportion of EPT taxa, and (f) Hilsenhoff's biotic index (HBI) calculated from Hester–Dendy and Hess samples collected annually from 2010 to 2014 in the Niobrara River. Higher values of all metrics except HBI indicate better ecosystem health. The bold line is the median, lower and upper box limits are the 25th and 75th percentiles, and whiskers represent the upper and lower limits of the data with circles indicating outliers. Asterisks indicate comparisons that are significant.
Current usage metrics show cumulative count of Article Views (full-text article views including HTML views, PDF and ePub downloads, according to the available data) and Abstracts Views on Vision4Press platform.
Data correspond to usage on the plateform after 2015. The current usage metrics is available 48-96 hours after online publication and is updated daily on week days.
Initial download of the metrics may take a while.