Fig. 2
Download original image
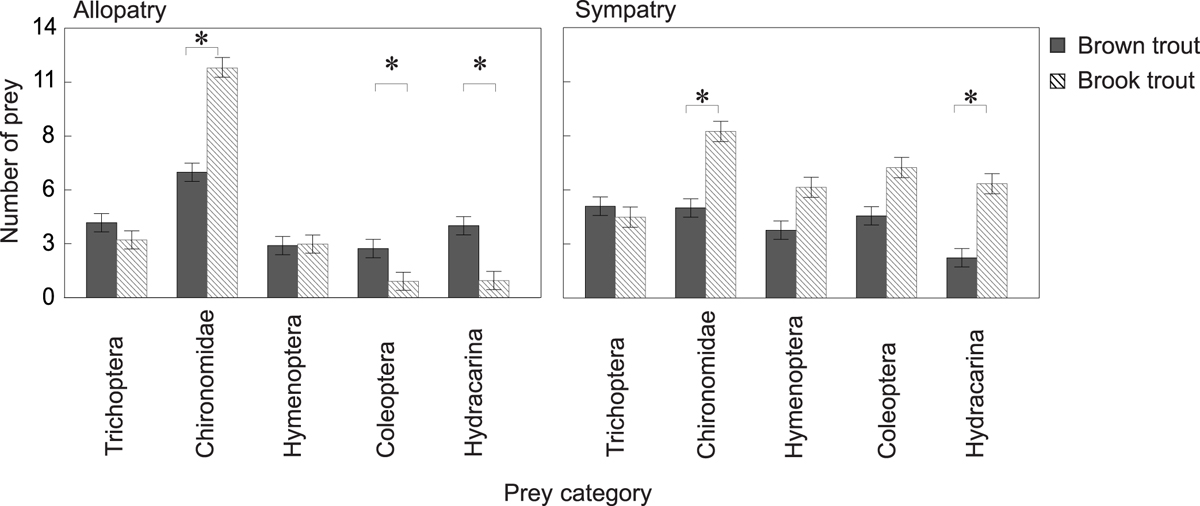
Number of prey for each analyzed food category (adjusted mean ± s.e.) found in the stomachs of brown trout and brook trout at the studied allopatric and sympatric localities. Only prey categories whose percent composition made up at least 10% of the stomach content are shown. Brackets with asterisks indicate significant differences between groups (⁎P < 0.05).
Current usage metrics show cumulative count of Article Views (full-text article views including HTML views, PDF and ePub downloads, according to the available data) and Abstracts Views on Vision4Press platform.
Data correspond to usage on the plateform after 2015. The current usage metrics is available 48-96 hours after online publication and is updated daily on week days.
Initial download of the metrics may take a while.