| Issue |
Knowl. Manag. Aquat. Ecosyst.
Number 417, 2016
|
|
|---|---|---|
| Article Number | 18 | |
| Number of page(s) | 11 | |
| DOI | https://doi.org/10.1051/kmae/2016005 | |
| Published online | 08 April 2016 | |
Research paper
Long-term changes of physicochemical parameters and benthos in Lake Qarun (Egypt): Can we make a correct forecast of ecosystem future?
Les changements à long terme des paramètres physico-chimiques et du benthos dans le lac Qarun (Égypte) : peut-on faire une prévision correcte du futur de l’écosystème?
1 The A. O. Kovalevsky Institute of Marine Biological Research of RAS, 299011 Sevastopol, Russia
2 National Institute of Oceanography and Fisheries, Fish Research Station, El-Khanater, El-Khairia, Cairo, Egypt
3 Egyptian Salts and Minerals Company (EMISAL), 10 El Messaha square, Dokki, Giza, Cairo, Egypt
⋆ Corresponding author: This email address is being protected from spambots. You need JavaScript enabled to view it.
Received: 21 December 2015
Revised: 1 February 2016
Accepted: 2 February 2016
Abstract
Biotic changes and a salinity increase (from 13 to 40 g.L-1) occurred in Lake Qarun (Egypt) since 1901. Was salinity increasing a cause of observed biotic changes? To answer this question we used benthos as a model group. Benthos and water sampling was conducted in different seasons (2008–2013). Comparing our and literature data, we discuss the long-term trends and possible causes of benthos changes. Salinity reached 3 g.L-1 in middle of 19th century; and biotic changes caused by this were started. From middle 19th century to 1928 a biotic transformation was driven by the salinity increase; after 1928 a regular alien species introduction caused that a marine community formed. In 1970–2000 eutrophication played a main role in species composition changes. In 2014 ctenophore Mnemiopsis leidyi introduced in the lake; eutrophication, chemical pollution, and a population dynamics of this ctenophore may be main drivers of the ecosystem change now. Benthos biomass gradually decreased during interval 1975–2013 without any correlation with salinity change. A variety of other factors than salinity may be significant in determining the structure and dynamics of communities, and we conclude that we have a small chance to make a correct forecast of possible future ecosystem changes in Lake Qarun.
Résumé
Des changements biotiques et une augmentation de la salinité (de 13 à 40 g.L-1) ont été observés dans le lac Qarun (Égypte) depuis 1901. L’augmentation de la salinité a-t-elle été une cause des changements biotiques observés ? Pour répondre à cette question, nous avons utilisé le benthos en tant que groupe modèle. Le benthos et l’eau ont été échantillonnés à différentes saisons (2008-2013). En comparant nos données à celles de la littérature, nous discutons des tendances à long terme et des causes possibles de l’évolution du benthos. La salinité a atteint 3 g.L-1 au milieu du 19e siècle; et les changements biotiques causés par cette salinité ont débuté. À partir du milieu du 19e siècle jusqu’à 1928 une transformation biotique a été causée par l’augmentation de la salinité; à partir de 1928 une introduction régulière d’espèces exotiques a fait qu’une communauté marine s’est formée. En 1970–2000 l’eutrophisation a joué un rôle principal dans les changements de la composition des espèces. En 2014 le cténophore Mnemiopsis leidyi a été introduit dans le lac; l’eutrophisation, la pollution chimique, et la dynamique de la population de ce cténophore peuvent être les principaux moteurs de l’évolution actuelle de l’écosystème. La biomasse du benthos diminue progressivement pendant l’intervalle 1975–2013 sans aucune corrélation avec le changement de salinité. Une diversité d’autres facteurs que la salinité peuvent être importants dans la détermination de la structure et de la dynamique des communautés, et nous concluons que nous avons peu de chance de faire une prévision correcte des possibles changements écosystémiques futurs dans le lac Qarun.
Key words: Saline lake / long-term changes/alien species / eutrophication / Mnemiopsis leidyi
Mots clés : Lac salé / changements à long terme / espèces exotiques/eutrophisation / Mnemiopsis leidyi
© N.V. Shadrin et al., published by EDP Sciences, 2016
 This is an Open Access article distributed under the terms of the Creative
Commons Attribution License CC-BY-ND (http://creativecommons.org/licenses/by-nd/4.0/), which permits
unrestricted use, distribution, and reproduction in any medium, provided the original
work is properly cited. If you remix, transform, or build upon the material, you may not
distribute the modified material.
This is an Open Access article distributed under the terms of the Creative
Commons Attribution License CC-BY-ND (http://creativecommons.org/licenses/by-nd/4.0/), which permits
unrestricted use, distribution, and reproduction in any medium, provided the original
work is properly cited. If you remix, transform, or build upon the material, you may not
distribute the modified material.
1 Introduction
Lakes are integrators and mirrors for the effects of climate change and human activity on watersheds, airsheds, and other landscape components. In recent decades an acceleration of lake ecosystem changes are observed worldwide; the reasons include the climate change, human population growth, and an intensification of human activities (O’Reilly et al., 2003; Smol et al., 2005; Anneville et al., 2007; Abbaspour et al., 2012; Shadrin and Anufriieva, 2013). We need to study the ongoing long-term changes of lake ecosystems to predict their further changes and mitigate unwanted impact on human well-being and activities. Lack of data on the long-term lake changes is a bottleneck in ecology of long-term changes, which does not allow to adequately understanding the causes and mechanisms ongoing changes. There are a lot of different papers on changes in Lake Qarun during last century (Naguib, 1958, 1961; Abdel-Malek and Ishak, 1980; Ishak and Abdel-Malek, 1980; El-Shabrawy and Dumont, 2009); Lake Qarun may serve as one important lake for a deeper understanding of the interconnections of causes and consequences of the long-term lake changes.
Lake Qarun, the third largest lake in Egypt, is located the northern Fayum (Faiyum), a natural depression extending over 12 000 km2, and was formed by wind erosion ca 1.8 million year ago (Ball, 1939). The depression is bounded by sandy hills, broken in the south, where Canal Bahr Yousef enters the depression. This canal is main source of water for the lake, and received fresh water from the Nile since early Pharaonic times, i.e., before 2500 BC (Hassan, 1986). Terraced lands allow a use of masonry weirs for the distribution of irrigation waters. Lake Qarun collects agricultural water through two drainages – El-Bats and El-Wadi systems. Since 1973, about 30% of this water has been diverted to a second depression, Wadi El Rayan, south-west of the Fayum (El-Shabrawy and Dumont, 2009). In 1952–1954 the annual average drainage waters entering into the lake were about 349.2 mln.m3 (Naguib, 1958) and in 2000s – about 400 mln.m3 (Abdel-Satar et al., 2010).
Archaeologists showed that the modern Lake Qarun is the shrunken remnant of Lake Moeris, which known from since 450 BCE. Herodotus, visited Egypt, saw a large water expanse, Lake Moeris, assumed artificial (Brown, 1892). At that time the lake was 75 m deep (20 masl), covered more than 2000 km2 and maintained by a seasonal supply of Nile water (Ball, 1939; Shafei, 1960). Different studies showed that the lake level has varied from relatively high levels in its early history to lower levels in later years, although there have been numerous changes in water level over the past 7000 years (Shafei, 1960; Mehringer et al., 1979; Nicoll, 2004). Lake Qarun has been profoundly affected by a combination of human activities and climatic changes over the past 5000 years (Mehringer et al., 1979; Nicoll, 2004; Baioumy et al., 2010). During last 2000 years, there were several periods of low water level; some of them were: 17 mbsl or lower in the third century A.D.; in 1245 AD, when Nabulsi gave a description of the Fayum area, the lake level fell to 30 mbsl; in 1805–1848, when Mohamed Ali ruled Egypt, – averaged 40 mbsl; in 1933–1934 – 45–46 mbsl (Baioumy et al., 2010). Dropping the lake level and an accumulation of salts increased salinity; Lake Qarun was only slightly brackish up until about 1884, and later salinity increased from 8.5 g.L-1 in 1905 to 38.0 g.L-1 in 1980 due to three factors (El-Shabrawy and Dumont, 2009; Baioumy et al., 2010). The first factor – evaporative losses increased; second – increased quantities of water were loss to the lake through groundwater outflow; and third – saline groundwater intruded into the lake (Ball, 1939; Meshal and Morcos, 1984; Flower et al., 2006; Baioumy et al., 2010). To reduce salinity in the lake, the Egyptian Salts and Minerals Company (EMISAL) was established on the southern coast of Lake Qarun in 1986 to extract salts and minerals (EMISAL, 1996). Its activity contributes to salt balance regulation in the lake now. Current salt balance in the lake (annual average) includes: (i) salt discharge via the main drains of 419.56 mln kg, (ii) ground water provide of 70.36 mln kg, and (iii) salts extracted by the EMISAL plant are of 416 mln kg. Concerning salt budget, during the last years (to 2007) Lake Qarun accumulated 70–85 mln.kg.year-1. This may lead to obvious increase of its salinity by 0.07 g.L-1.year-1 (Abd Ellah, 2009). Could such a salinity increase lead to the catastrophic changes in the lake ecosystem?
During last 100 years there were pronounced changes in structure and functioning of biota in the lake; many researchers explained these changes by the salinity increase (Naguib, 1958; Abdel-Malek and Ishak, 1980; Ishak and Abdel-Malek, 1980; Mageed, 2005; El-Shabrawy and Dumont, 2009). There is another point of view that salinity variation is not a main cause of zooplankton changes in the lake during the last decades (El-Shabrawy et al., 2015). Is fluctuating salinity the main determinant of biotic changes in Lake Qarun? The question remains open. To answer these questions we used benthos as a model group. Changes in biota occur on different temporal scales (diurnal, seasonal, and inter-annual). Plankton species are more sensitive to environmental changes than benthos due to their small sizes; sometime their seasonal and other short-term fluctuations exceed the inter-annual differences. Thus benthos may be used more successfully than plankton to assess the inter-annual changes and their causes in ecosystems.
Aims of our paper are to provide new data (2008–2013) on current changes of chemical parameters and benthos in Lake Qarun, and comparing them with data available in literature to discuss the long-term trends and causes of benthos changes.
 |
Fig. 1 Scheme of sampling stations in Lake Qarun (Egypt). |
2 Materials and methods
2.1 Study area
Lake Qarun is a closed saline lake in the northern part of El-Fayum Depression (Middle Egypt, ~80 km southwest of Cairo, at the margin of the Nile Valley). The studied lake lays on 29° 30’ N, 30° 30′ E (Figure 1) and is 43–43.5 mbsl now (Abdel-Satar et al., 2010). The lake length from east to west is about 40 km, and the maximal width is about 6.7 km. The lake has a surface area of 243 km2 and a volume of 924 mln.m3 (El-Shabrawy and Dumont, 2009). Maximum depth (~8.3 m) is in the northwest part. Non-irrigated northern shores of the lake are actually devoid of vegetation and mark the beginning of the Western Egyptian Desert. The lake has no connection to the sea, being located 320 km south of the Mediterranean coast of Egypt, and is sustained directly by the Nile River via Canal Bahr Yousef.
2.2 Sample collection
Benthos and water sampling was conducted during different seasons from March 2008 to February 2009 and from August 2011 to November 2013 on ten stations in Lake Qarun (Figure 1). Macrobenthos samples were collected by Ekman grab (0.023 m2 opening area). The samples were sieved using a bolter of 0.4 mm mesh diameter, and washed with lake water to remove mud or other fine particles. The organisms retained in the bolter were preserved in 10% neutral formalin solution. In the laboratory, the samples were rewashed with tap water to remove any silt remains. Sorting of the specimens was carried out by taking successive small sub-samples and examining them under a stereomicroscope (×40 magnification). The bottom organisms were sorted into main groups. Each group was examined and sorted into genera or species (Lincoln, 1979; Brown, 1980; Ruffo, 1982; Fischer et al., 1987; Shiganova and Malej, 2009). Both the number and wet weight of each species were measured after retaining the organism on filter paper for 3 min before weighing. All mollusk species were weighed with shell. Additionally, to analyze changes in chemical composition during 2002–2013, we sampled water every day at one point near EMISAL pumping station (29° 28′ N, 30° 41′ E) (Figure 1).
Physico-chemical parameters and their variability in Lake Qarun during 2008–2013 (Seasonal average/CVs)*.
Nutrient concentrations and their variability in Lake Qarun during 2008–2013 (Seasonal average/CVs).
Water samples were taken by 1 L bathometer. Water temperature (°C) and pH were in-situ measured using Hydrolab (Multi Set 430i WTW). Transparency was measured using a white/black Secchi disk (0.3 m in diameter). Salinity (g.L-1) was determined as Total dissolved solids (TDS) by filtrating a sample with glass micro fiber filter (GF/C) and a known volume of filtrate was evaporated at 180 °C. Dissolved oxygen (DO, mg.L-1) was carried out using modified Winkler method. Biological oxygen demand (BOD) was determined by using 5 days incubation method. Chemical oxygen demand (COD) was carried out using potassium permanganate method. Water alkalinity was determined immediately after sampling collection using phenol-phthalein and methyl orange indicators. Nitrogen-Ammonia (N-NH3) was determined by phenate method. Nitrogen-Nitrite (N-NO2) was determined using colorimetric method with formation of reddish purple azo-dye. Nitrogen-Nitrate (N-NO3) was measured as nitrite after cadmium reduction. Orthophosphate (P-PO4) was estimated by using ascorbic acid molybdate method. Reactive silicate (SiO4) determined using molybdate methods. Total nitrogen (TN) and total phosphorus (TN) were measured as nitrate and orthophosphate respectively, after persulphate digestion (APHA, 1995).
2.3 Statistical analysis
Data were subjected to standard statistical processing (Sokal and Rohlf, 1995). Variability of parameters in the samples was qualified by the coefficient of variability (CV). Pair coefficients of correlations (R) were calculated. Significance of differences in average values was evaluated by a Student’s t-test, and confidence level of correlation coefficients (p) was determined by comparison with parameter critical values (Müller et al., 1979).
3 Results
During 2008–2013, there were pronounced seasonal and inter-annual changes of abiotic characteristics in Lake Qarun (Tables 1 and 2). The levels of spatial variability of measured parameters were very different; temperature (CV = 0.028−0.071) and pH (CV = 0.011−0.041) were parameters with lowest spatial variability in the lake; highest variability was observed in concentrations of NO2(CV = 0.525−2.091), NO3 (CV = 0.752−1.751), NH3 (CV = 0.565−1.635), and PO4 (CV = 0.171−1.071). CVs in Table 1 show that the levels of spatial variability of abiotic parameters fluctuated in time. Stations that had smallest salinity and highest nutrient concentrations and turbidity were most closed to the discharges of waters from El-Bats and El-Wadi drainage systems (Figure 1). To analyze salinity changes after 2000, we used annual average data (2002–2013) for one point near EMISAL pumping station. After 2002, salinity fluctuated without any positive or negative trend (Figure 2); average salinity was 36.1 g.L-1 (CV = 0.06).
 |
Fig. 2 Diagram showing salinity changes in Lake Qarun between 1901 and 2013. |
Ion composition changed over the period from 2002 to 2013. The proportion of SO4/Cl slightly increased from 2002 to 2013. The proportion of CO /HCO
/HCO decreased; this decrease may be approximated by (R = −0.636, p = 0.025):
  (1)where x – a year number since 2001.
During period of our study (2008–2013) 16 macrobenthic species were found in total (Table 3). In 2008–2013 Polychaeta Polydora hoplura Claparède, 1869 and Ficopomatus enigmaticus (Fauvel, 1923), Gastropoda Nassarius cuvierii (Payraudeau, 1826), found in the lake at first time in 2006, were the common species. Frequencies of common species occurrence (FO) changed from 2006 to 2013 (Table 4); during this time there was a trend of FO decrease of several species. The correlation coefficients (R) between FO and the numbers of year since 2006 were calculated. This negative trend was significant for P. hoplura (R = −0.935, p = 0.01) and for Amphipoda Monocorophium acherusicum (Costa, 1853) (R = −0.855, p = 0.05).
Species composition and parts of the different species in total macrozoobenthos biomass g (wet weight) m-2 in Lake Qarun during 1974–2013.
Frequencies of different species occurrence in samples in different years (%).
Total average macrozoobenthos abundances and their variability in the Lake Qarun during 2006–2013 (ind.m-2).
Total macrozoobenthos biomass g (wet weight) m-2 in Lake Qarun during 2006–2013.
Annual average individual wet weight (g) in populations of the different species in Lake Qarun during 1989–2013.
Total annual average abundance of macrozoobenthos fluctuated between 536 and 1229 ind.m-2 (average 840 ind.m-2; CV = 0.310) (Table 5).There is a negative temporal trend of total benthos abundance change. Total annual average zoobenthos biomass fluctuated from 26.5 g fresh wt.m-2 to 70.3 g fresh wt.m-2 (Table 6); there was no directed trend of its change. In benthos, Bivalvia dominated (in biomass) (Table 3); Cerastoderma glaucum (Bruguière, 1789) contributed in total biomass 12.2–44.6%, Polititapes aureus (Gmelin, 1791) –20.8–71.4%, and both species – 51.7–83.6%. In 2012 the contribution of Bivalvia in total biomass was lowest – 51.7% and the contributions of other animal groups were highest: Crustacea Brachynotus sexdentatus (Risso, 1827) – 15.1% and Polychaeta Hediste diversicolor (Müller, 1776) – 19.3%. Individual annual average wet weight in macrobenthos fluctuated between 0.029 and 0.074 g (average = 0.057g, CV = 0.307) (Table 6).
Populations of abundant species also demonstrated inter-annual differences in individual annual average wet weight (Table 7). There are temporal trends of individual average weight changes. For P. aureus the trend was negative, and for H. diversicolor it was positive, but both trends were insignificant. The negative trend for Crustacea Fistulobalanus pallidus (Darwin, 1854) was significant (R = −0.086, p = 0.05). Calculated CVs (coefficients of spatial variability) show that a spatial distribution of macrobenthos biomass was not homogenic; annual average CVs changed between 0.640 and 1.479 (Table 6). Seasonal variability of biomass (CVt) in 2006–2012 was close in different years (Table 6); CVt fluctuated between 0.502 and 0.593 over this interval.
4 Discussion
4.1 Long-term changes of abiotic characteristics
Totality of available data on salinity since 1901 (Naguib, 1958; Ishak and Abdel-Malek, 1980; Meshal and Morcos, 1984; Soliman, 1991; Sabae and Ali, 2004; Abd Ellah, 2009; El-Shabrawy and Dumont, 2009; Abdel-Satar et al., 2010; El-Shabrawy et al., 2015) was summarized (Figure 2). We see that there was strong salinity increase since 1901 (13 g.L-1) to approximately 2000, which may be approximated by the equation (R = 0.935, p = 0.0001):  (2)where S – salinity, g.L-1, t – a number of year (since 1901).
Later there were only small fluctuations. Taking into account a range of observed current fluctuations salinity may reach 44–45 g.L-1 in 2100. If we take into account that EMISAL increases salt extraction to 535 thousand tons now and plans to increase its production more, a real salinity increase in future would be less.
Study of sediment cores from Lake Qarun showed that benthic foraminifera first appeared at 0.314 m depth, ca. AD 1550; this depth marks the beginning of colonization of the lake by foraminifera and indicates a change in lake water salinity, as foraminifera cannot tolerate freshwater (Abu-Zied et al., 2011). Comparing this result with calculated by equation (2) we may conclude that the salinity increase before middle 19th century was very slow and fluctuating. Study of sediment cores demonstrates such fluctuations; salinity was highest around AD 1700 and after AD 1990 (Abu-Zied et al., 2011). There is some superposition of natural rhythms in salinity fluctuation; we need to interpret these accurately to predict of further salinity changes in the lake.
There were the significant temporal trends for changes of other abiotic parameters. Using own and published data (Sabae and Ali, 2004; Abd Ellah, 2009; El-Shabrawy and Dumont, 2009; Abdel-Satar et al., 2010; El-Shabrawy et al., 2015) we found that some changes in ion composition occurred; proportion SO4/Cl grew. This growth may be approximated by equation (R = 0.558, p = 0.001):  (3)where x – a number of year since 1995.
We used data from literature (Sabae and Ali, 2004; Abd Ellah, 2009; El-Shabrawy and Dumont, 2009; Abdel-Satar et al., 2010; El-Shabrawy et al., 2015) and analyzed a long-term change of K concentration in the lake. Proportion K/Na decreased and its inter-annual dynamics may be approximated (R = −0.888, p = 0.001):  (4)where x – a number of year since 1995.
K plays a very important role in functioning of cells; its part in total salt content decreased over this time interval; and it may affect biota. Ionic composition may influence the composition of the biota but the mechanisms of those influences on an animal composition in saline lakes remain obscure (Williams, 1998).
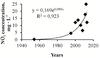 |
Fig. 3 Diagram showing changes of average NO2 concentration in Lake Qarun in 1954–2013 (x – number of years from 1954). |
More pronounced current long-term changes were found for concentrations of biogenic elements in Lake Qarun. From 1954 to 2013, there was high exponential growth of concentrations of NO2 – from 0.16 μg.L-1 in 1954–1955 to 18.5–22 μg.L-1 in 2012–2013 (Figure 3) as well as for NO3 – from 34.84 μg.L-1 in 1954–1955 to 122.5–226.5 μg.L-1 in 2011–2013. For PO4 there was a significant (p = 0.001) gradual increase from 0.38 μg.L-1 in 1954 to 94.0 μg.L-1 in 2003 and a significant (p = 0.001) decrease to 14.2–42.9 μg.L-1 in 2011–2013. For SiO4 a significant (p = 0.001) gradual decrease from 17.7 mg.L-1 in 1954 to 2.1 mg.L-1 in 2013 was recorded. Average-annual transparence in the lake decreased from 2.39 m in 1975 (Mageed, 1998) to 0.85 m during studied period. Those are signs of eutrophication development in the lake with all associated events. Lake Qarun is the largest reservoir of agricultural and sewage drainage of Fayoum province as well as the drainage from fish farms established around the lake, which cause eutrophication. However, there is one more cause, which intensifies eutrophication, – global climate warming. Climate change, by intensifying storms, affecting rainfall patterns, warming soils, and others, may increase diffuse nutrient loading (Jeppesen et al., 2011). People can control nutrients in wastewaters, but those nutrients that run from the land are seemingly intractable (Moss et al., 2011). As a result of eutrophication, recurrent microalgae blooming phenomenon was recorded in the last years (2008–2012) at autumn or winter seasons with remarkable water discoloration to red; mass mortality of animals occurs (Abou El-Geit et al., 2013). There is no thermal stratification in the lake, but there is chemocline during most part of a year; increased salinity, depletion of oxygen concentration, and H2S were observed near the bottom as early as in 1954 (Naguib, 1958, 1961). This creates a possibility of “dead” zones on the bottom and mass mortality events in benthos.
Mollusk species in Lake Qarun in 1907 (Smith, 1908).
4.2 Changes in species composition
With increasing salinity above 3 g.L-1, the composition of the biota of salt lakes increasingly diverges from that of fresh waters; but in waters with salinities between 3 and 20 g.L-1, most taxa present are also found in freshwater (Williams, 1998). In Lake Qarun, salinity reached 3 g.L-1 in middle of 19th century; and biotic changes caused by this were started. Changes occurred in plankton and benthos among all taxa. Many saline lake species have dormant stages, which can be transported for long-distance by birds, flying insects and winds (Caceres and Soluk, 2002; Figuerola et al., 2003; Anufriieva and Shadrin, 2014). Birds may serve as a transportation vector also for some mollusks that known long time (Darwin, 1859). In 1907 two Bivalvia species were found in the lake: Corbicula fluminalis (Müller, 1774) and C. africana (Krauss, 1848) and 9 Gastropoda species (Table 8). All these species are the Nilotic freshwater forms (Smith, 1908) but there was also a marine hydrozoan species Cordylophora (Cunnington and Boulenger, 1907) At same time in 1907 some typical freshwater animals that were common in Nile and connected fresh water bodies, were apparently not presented in Lake Qarun (Cunnington and Boulenger, 1907). A successive settlement of a primarily marginal marine bottom fauna has begun in Lake Qarun. C glaucum introduced to the lake between 1907 and 1927 (Gardner, 1932; Kowalke, 2005) In 1974–1977 only three mollusk species: Hydrobia aponensis (Martens, 1855), Melanoides tuberculata (Müller, 1774), and Cleopatra bulimoides (Olivier, 1804) from 11 species, found in 1907, were rarely presented in the lake. Those three species have not been detected after 1977. In 1952–1955 three genera of marine mollusks dominated in the lake – Bivalvia Cerastoderma and Mactra, Gastropoda Potamides (Naguib, 1958). In 1974 and later Mactra was not recorded in the lake, and Polititapes aureus replaced it in the lake benthos (Table 2).
In 1907 14 fish species inhabited in the lake, the overwhelming majority of these are two species of Tilapia; fishes occurred “in astonishing abundance” (Cunnington and Boulenger, 1907). Fishery was very important for local people. After 1907 there was a dramatic decrease of fish productivity due to salinity increased; it gradually eliminated all fish species except one species Tilapia and Anguilla (Faouzi, 1936). We suppose that from middle 19th century to 1928 there was first stage of a modern biotic transformation in Lake Qarun when a salinity increase drove the biotic changes.
Due to extinction of native fish fauna in Lake Qarun, the commercial catch dropped from 4000 t in 1920 to 1000–2000 t in 1925–1926, affecting the livelihood of the fishery community around the lake (Faouzi, 1936). To improve fishery a decision was made about intentional introduction of marine fishes and crustaceans into the lake. Mullet species: Mugil cephalus (Linnaeus, 1758), Liza ramada (Risso, 1827), L. saliens (Risso, 1810), L. aurata (Risso, 1810) and other fishes such as Atherina boyeri (Risso, 1810), Anguilla anguilla (Linnaeus, 1758), Solea aegyptiaca (Chabanaud, 1927), as well as several prawn species: Metapenaeus stebbingi (Nobili, 1904), Palaemon elegans (Rathke, 1837) and Penaeus semisulcatus (De Haan, 1844) were transplanted to the lake in 1928 (Mageed, 2005; El-Shabrawy and Dumont, 2009). Some of the introduced species can reproduce in the lake. M. cephalus, L. ramada and L. aurata cannot breed; they are continuously transported in the lake since 1928. About two million of fry were annually released during 1928–1964 (El-Zarka and Kamel, 1965), 55 million between 1971 and 1978, and more than 100 million of fry later (El-Shabrawy and Dumont, 2009). This transplantation led to an occasional introduction of different marine species, both planktonic and benthic.
In 1928 there was a start of second stage of modern changes in the lake biota. Now there is a marine community in the lake, which continues to change. Main driver of this were a regular introduction of alien species and a press of aliens on the existent species. Almost all of introduced fishes and prawns in the lake are bottom feeders impacting on structure and dynamics of zoobenthos (El-Shabrawy and Khalifa, 2007). In addition, bottom fishing gears impact on the lake floor, causing mortality and injury to surface-living and shallowly buried fauna. The towed fishing gears, used for prawn, greatly affect macrobenthos structure in Lake Qarun (El-Shabrawy and Khalifa, 2007).
We assume that after 1970 eutrophication played a main role in the changes of species composition in the lake (third stage of the change). Table 3 shows a change in species structure during that stage. Intermittent hypoxia/anoxia in the lake’s bottom waters, caused by human eutrophication, may account for these most recent changes.
Long-term changes of total macrobenthos average biomass in Lake Qarun during 1974–2013 g (wet weight) m-2.
Last alien species, occasional introduced in Lake Qarun, was the warty comb jelly Mnemiopsis leidyi (Agassiz, 1865) was first reported at Lake Qarun in March 2014 (El-Shabrawy et al., 2015). Large numbers of the ctenophore was reported by many fishermen and the researchers of National Institute of Oceanography and Fisheries. Probably, M. leidyi was accidentally introduced in the lake through the mullet fry transportation. Mnemiopsis leidyi was recorded also in the second lake of the Fayum depression – Lake Wadi el Rayan, where large swarms had been recorded (El-Shabrawy et al., 2015). Mnemiopsis leidyi was introduced in the Black Sea in the 1980s, with catastrophic results for the Black Sea ecosystem and fishery industry (Gomoiu et al., 2002). It was supposed that eutrophication and ecosystem destabilization promoted the successful occupation of the Black Sea and other seas by M. leidyi. This introduction may lead to start a new stage of the change of biotic structure in Lake Qarun when eutrophication, chemical pollution and a population dynamics of this ctenophore may be main drivers of the ecosystem change.
4.3 Quantitative changes in benthos
We used the data published since 1974 (Abdel-Malek and Ishak, 1980; El-Shabrawy and Khalifa, 2007; El-Shabrawy and Dumont, 2009) to analyze long-term trend of benthos biomass change (Table 9, Figure 4). Best approximation gives an equation (R = −0.969, p = 0.0005): 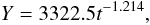 (5)where Y – biomass, g.wt.w.m-2, t – year number (since 1974).
No correlation was found between changes of benthos biomass and salinity; salinity did not significantly influence on biomass changes from 1974. No significant correlations were found between inter-annual changes of benthos biomass and NO3 or PO4; there was linear slight positive influence of NO2 on benthos biomass in 1974–2013 (R = 0.885, p = 0.01). We conclude that changes of biogenic element concentrations did not directly cause of long-term benthos biomass changes but, probably, their high concentration led to the benthos biomass decrease causing episodically microalgae blooms and mass mortality events in the lake.
Inter-annual fluctuations of individual average weight in macrozoobenthos do not demonstrate any directed trend since 1989 (Table 7). Individual annual average weight in the populations of some single species changed very much. Annual average weight (AAW) of C. glaucum fluctuated between 0.440 and 0.845 g (average = 0.694, CV = 0.241) in 1989–2000, and – between 0.115 and 0.261 g (average = 0.183, CV = 0.316) in 2006–2013. Differences are high significant (p = 0.001). Similar trends were also found for P. aureus and F. pallidus. For P. aureus in 1989–2000 AAW was 0.510 g (CV = 0.464) and in 2006–2013 AAW was 0.189 g (CV = 0.266). For F. pallidus in 1989–2000 AAW was 0.214 g (CV = 0.492) and in 2006–2013 AAW was 0.082 (CV = 0.109). H. diversicolor did not demonstrate such AAW change. We think that there was shortening of life span of above noted species due to microalgae blooms causing mass mortality of animals. It is known that older invertebrates, including mollusks, demonstrate less resistance to stressing factors than younger individuals (Shadrin et al., 1993). An observed decrease of occurrence frequency may be also explained by episodical microalgae blooms and mass mortality of benthic species. Probably, this may also explain an increase of spatial heterogeneity (CVs) in total benthos biomass distribution; development of microalgae blooms may lead to formation of local anoxic dead zones on bottom.
Discussing changes in Lake Qarun we must include pollution by heavy metals, pesticides, and other pollutants (Mansour and Sidky, 2003; Authman and Abbas, 2007). Because Lake Qarun is terminal with an intensive evaporation the salts, heavy metals and pesticides, carried by agricultural and municipal drainage waters, accumulate in the lake. A current level of pollutants in the lake also contributes to increased mortality of the different species, and diminished immunity and reproduction (Mansour and Sidky, 2003; Authman and Abbas, 2007). We conclude that multiple factors contribute to current changes in Lake Qarun benthos with different chain, domino, top-down and up-down effects. So it is very difficult task to isolate the specific causes of modern long-term changes in Lake Qarun ecosystem.
 |
Fig. 4 Diagram showing benthos biomass changes in Lake Qarun in 1974–2013. |
Williams (1998) concluded that, irrespective of whatever factors determine community structure; salinity may have rather little impact over wide ranges of salinity in salt lakes with salinities generally in excess of 50 g.L-1. Same conclusion was made for zooplankton changes in the lake (El-Shabrawy et al., 2015). So since 1928 salinity had rather little impact on benthic changes in Lake Qarun. Most common and abundant species in the lake are high halotolerant. As example, Bivalvia C. glaucum can live under salinity up to 70–80 g.L-1, Crustacea Gammarus aequicauda (Martynov, 1931) – to 80–100 g.L-1 and Sphaeroma serratum (Fabricius, 1787) – to 85 g.L-1, the most abundant species in Lake Qarun meiobenthos Ostracoda Cyprideis torosa (Jones, 1850) – to 150 g.L-1 (Neale, 1988; Kowalke, 2005). According with the current trend, salinity will not reach 50 g.L-1 in 21 century in Lake Qarun; increasing salinity will not be a key driver of changes in Lake Qarun ecosystem in 21 century.
5 Conclusions
A variety of other factors than salinity (hydrological patterns, chemical pollution, modern and past climatic dynamics, ecosystem memory – a bank of resting stages, chance, human activities, and various forms of biotic interactions) may, in various combinations, be significant in determining the structure and short- and long-term dynamics of communities in Lake Qarun. Taking into account all above as well the shapes of poor-known natural rhythms and multiplicity of ecosystem stable states in saline lakes (Shadrin, 2013), we conclude that we have a very small chance to make a correct forecast of possible ecosystem changes in Lake Qarun. And this chance is dropping further due to enhanced climate instability (McElroy and Baker, 2012). “When sorrows come, they come not single spies, but in battalions” (Shakespeare, “Hamlet”); violating natural landscape and ecological connectivity we multiply the problems, including a prediction of future changes. However, this does not mean that we should lose heart; we need to pay more attention to stabilize the lake ecosystem and regulate concentrations of N, P, and various pollutants in the lake. An intelligent use of artificial reefs may be one of the tools to go to regulation of nutrient and pollutant concentrations, and stabilization of biotic composition in the lake (Canfield et al., 2000).
Acknowledgments
We thank all, who helped us in field works during this study, and the Otto Kinne Foundation for its fellowship to E. V. Anufriieva. We very appreciate a help of Dr. K. Nicoll (University of Utah, USA) to improve English in our manuscript.
References
- Abbaspour M., Javid A.H., Mirbagheri S.A., Ahmadi F.G. and Moghimi P., 2012. Investigation of lake drying attributed to climate change. Int. J. Environ. Sci. Technol., 9, 257–266. [Google Scholar]
- Abd Ellah R.G., 2009. Outlook on past, present and future status of water salinity in Lake Qarun, Egypt. World J. Fish Marine Sci., 1, 51–55. [Google Scholar]
- Abdel-Malek S.A. and Ishak M.M., 1980. Some ecological aspects of Lake Qarun, Fayum, Egypt. Part II: production of plankton and benthic organisms. Hydrobiologia, 75, 201–208. [CrossRef] [Google Scholar]
- Abdel-Satar A.M., Goher M.E. and Sayed M.F., 2010. Recent Environmental changes in water and sediment quality of Lake Qarun, Egypt. J. Fish. Aquat. Sci., 5, 56–69. [CrossRef] [Google Scholar]
- AbouEl-Geit E.N., Saad T.T., Abdo M.H. and Mona S.Z., 2013. Microbial infections among some fishes and crustacean species during blooming phenomenon in Qarun Lake-Egypt. Life Sci. J., 10, 1217–1224. [Google Scholar]
- Abu-Zied R.H., Keatings K., Flower R.J. and Leng M.J., 2011. Benthic foraminifera and their stable isotope composition in sediment cores from Lake Qarun, Egypt: changes in water salinity during the past ~500 years. J. Paleolimnol., 45, 167–182. [CrossRef] [Google Scholar]
- Anneville O., Molinero J.C., Souissi S., Balvay G. and Gerdeaux D., 2007. Long-term changes in the copepod community of Lake Geneva. J. Plankton Res., 29, i49–i59. [CrossRef] [Google Scholar]
- Anufriieva E. and Shadrin N., 2014. Resting stages of crustaceans in the Crimean hypersaline lakes (Ukraine) and their ecological role. Acta Geol. Sin. (English Edition), 88 (Suppl. 1), 46–49. [CrossRef] [Google Scholar]
- APHA (American Public Health Association), 1995. Standard methods for the examination of water and waste water, 19th edition., American Public Health Association, Washington D.C., USA. [Google Scholar]
- Authman M.M.N. and Abbas H.H.H., 2007. Accumulation and distribution of copper and zinc in both water and some vital tissues of two fish species (Tilapia zillii and Mugil cephalus) of Lake Qarun, Fayoum province, Egypt. Pak. J. Biol. Sci., 10, 2106–2122. [CrossRef] [PubMed] [Google Scholar]
- Baioumy H.M., Kayanne H. and Tada R., 2010. Reconstruction of lake-level and climate changes in Lake Qarun, Egypt, during the last 7000 years. J. Great Lakes Res., 36, 318–327. [CrossRef] [Google Scholar]
- Ball J., 1939. A contribution to the geography of Egypt. Survey and Mines Department (Government press), Cairo. [Google Scholar]
- Brown R.H., 1892. The Fayum and Lake Moeris. Edward Stanford, London. [Google Scholar]
- Caceres C.E. and Soluk D.A., 2002. Blowing in the wind: a field test of overland dispersal and colonization by aquatic invertebrates. Oecologia, 131, 402–408. [CrossRef] [PubMed] [Google Scholar]
- Canfield Jr.D.E., Bachmann R.W. and Hoyer M.V., 2000. A management alternative for Lake Apopka. Lake Res. Manage., 16, 205–221. [CrossRef] [Google Scholar]
- Cunnington WA. and Boulenger CL., 1907. Biological expedition to the Birket et Qurun. Nature 76, 316. [Google Scholar]
- Darwin Ch., 1859. On the origin of species by means of natural selection, or the preservation of favoured races in the struggle for life. Nauka, Saint-Petersbur, 1991, Russian edition. [Google Scholar]
- El-Shabrawy G.M. and Dumont H.J., 2009. The Fayum Depression and its Lakes. In: Dumont H.J. (ed.), The Nile. Monographiae Biologicae, Springer, Dordrecht, 95–124. [Google Scholar]
- El-Shabrawy G.M. and Khalifa N., 2007. Seasonal and long-term changes of macrobenthos in Lake Qarun, Egypt. J. Egypt. Acad. Soc. Environ. Develop., 8, 1–15. [Google Scholar]
- El-Shabrawy G.M., Anufriieva E.V., Germoush M.O., Goher M.E. and Shadrin N.V., 2015. Does salinity change determine zooplankton variability in the saline Qarun Lake (Egypt)? Chin. J. Oceanol. Limnol., 33, 1368–1377. [Google Scholar]
- El-Zarka S. and Kamel F., 1965. Mullet fry transplantation and its contribution to the fisheries of inland brackish lake in the United Arab Republic. Proc. Gen. Fish. Coun. Medit., 8, 209–226. [Google Scholar]
- EMISAL (Egyptian Company of Salts and Minerals), 1996. Qarun Lake, a base for an advanced chemical industry complex, investment opportunities based on salt extraction from Lake Qarun and the integrated industries based on it. Egyptian Salts and Minerals Co. Ltd., London. [Google Scholar]
- Faouzi H., 1936. Successful stocking of Lake Qarun with mullets. Int. Rev. Hydrobiol., 33, 434–439. [CrossRef] [Google Scholar]
- Figuerola J.Green A.J. and Santamaría L., 2003. Passive internal transport of aquatic organisms by waterfowl in Doñana, south-west Spain. Global Ecol. Biogeogr., 12, 427–436. [CrossRef] [Google Scholar]
- Flower RJ, Stickley C, Rose NL, Peglar S, Fathi AA., and Appleby PG., 2006. Environmental changes at the desert margin: an assessment of recent paleolimnological records in Lake Qarun, Middle Egypt. J. Paleolimn., 35, 1–24. [CrossRef] [Google Scholar]
- Gardner EW., 1932. Some lacustrine mollusca from the Faiyum depression: a study in variation. Mem Inst. Egypte. 18, 1–123. [Google Scholar]
- Gomoiu M.T., Alexandrov B., Shadrin N. and Zaitsev Y., 2002. The Black Sea - a recipient, donor and transit area for alien species. In: Leppakoski E., Gollasch S., Olenin S. (eds.), Invasive aquatic species of Europe. Distribution, impacts and management, Kluwer Academic Publishers, Dordrecht, 341–350. [Google Scholar]
- Hassan F.A., 1986. Holocene lakes and prehistoric settlements of the western Fayum. J. Archaeol. Sci., 13, 483–501. [Google Scholar]
- Ishak M.M. and Abdel-Malek S.A., 1980. Some ecological aspects of Lake Qarun, Fayoum, Egypt. Part I. Physico-chemical environment. Hydrobiologia, 74, 173–178. [CrossRef] [Google Scholar]
- Jeppesen E., Kronvang B., Olesen J.E., Audet J., Søndergaard M., Hoffmann C.C., Andersen H.E., Lauridsen T.L., Liboriussen L., Larsen S.E., Beklioglu M., Meerhoff M., Ozen A. and Ozkan K., 2011. Climate change effects on nitrogen loading from cultivated catchments in Europe: implications for nitrogen retention, ecological state of lakes and adaptation. Hydrobiologia, 663, 1–21. [CrossRef] [Google Scholar]
- Kowalke T., 2005. Mollusca in marginal marine and inland saline aquatic ecosystems examples of Cretaceous to extant evolutionary dynamics. Zitteliana, A45, 35–63. [Google Scholar]
- Mageed A.A., 1998. Distribution and salinity ranges of zooplankton organisms at El-Fayoum Depression (El-Fayoum-Egypt). Egypt. J. Aquat. Biol. Fish., 2, 51–71. [CrossRef] [Google Scholar]
- Mageed A.A., 2005. Effect of some environmental factors on the biodiversity of holozooplankton community in lake Qarun, Egypt. Egypt. J. Aquat. Res., 31, 230–250. [Google Scholar]
- Mansour SA and Sidky MM., 2003. Ecotoxicological Studies. 6. The first comparative study between Lake Qarun and Wadi El-Rayan wetland (Egypt), with respect to contamination of their major components. Food Chem., 82, 181–189. [CrossRef] [Google Scholar]
- McElroy M. and Baker D.J., 2012. Climate extremes: Recent trends with implications for national security. Harvard University Center for the Environment. http://environment.harvard.edu/sites/default/files/clim ate_extremes_report_2012-12-04.pdf [Google Scholar]
- Mehringer Jr.P.J., Petersen K.L. and Hassan F.A., 1979. A pollen record from Birket Qarun and the recent history of the Fayum, Egypt. Quat Res., 11, 238–256. [CrossRef] [Google Scholar]
- Meshal A.H. and Morcos S.A., 1984. Evaporation from Lake Qarun and its water budget. J. Cons. Int. Explor. Mer., 41, 140–144. [CrossRef] [Google Scholar]
- Moss B., Kosten S., Meerhoff M., Battarbee R.W., Jeppesen E., Mazzeo N., Havens K., Lacerot G., Liu Z., De Meester L., Paerl H. and Scheffer M., 2011. Allied attack: climate change and eutrophication. Inland Waters, 1, 101–105. [CrossRef] [Google Scholar]
- Müller P.H., Neuman P. and Storm R., 1979. Tafeln der mathematischen Statistik, VEB Fachbuchverlag, Leipzig. [Google Scholar]
- Naguib M., 1958. Studies on the ecology of Lake Qarun (Fayum, Egypt). Part I. Kieler Meeresforschungen, 14, 187–222. [Google Scholar]
- Naguib M., 1961. Studies on the ecology of Lake Qarun (Fayum, Egypt). Part II. Kieler Meeresforschungen, 17, 94–131. [Google Scholar]
- Neale J.W., 1988. Ostracods and palaeosalinity reconstruction. In: De Deckker P., Colin J.P., Peypouquet J.P. (eds.), Ostracoda in earth sciences, Elsevier, Amsterdam, 125–155. [Google Scholar]
- Nicoll K., 2004. Recent environmental change and prehistoric human activity in Egypt and Northern Sudan. Quat. Sci. Rev. 23, 561–580. [CrossRef] [Google Scholar]
- O’Reilly C.M., Alin S.R., Plisnier P.-D., Cohen A.S. and McKee B.A., 2003. Climate change decreases aquatic ecosystem productivity of Lake Tanganyika, Africa. Nature, 424, 766–768. [CrossRef] [PubMed] [Google Scholar]
- Sabae S.Z. and Ali M.H., 2004. Distribution of nitrogen cycle bacteria in relation to physicochemical conditions of a closed saline lake (Lake Qarun, Egypt). J. Egypt. Acad. Soc. Environ. Develop. (D-Environmental studies), 5, 145–167. [Google Scholar]
- Shadrin N.V., 2013. Alternative stable states of lake ecosystems and critical salinities: is there a rigid connection? Proceedings of the Zoological Institute, Suppl. 3, 214–221 (in Russian). [Google Scholar]
- Shadrin N.V. and Anufriieva E.V., 2013. Climate change impact on the marine lakes and their Crustaceans: The case of marine hypersaline Lake Bakalskoye (Ukraine). Turk. J. Fish. Aquat. Sci., 13, 603–611. [Google Scholar]
- Shadrin N.V., Machkevsky V.K. and Lezhnev I.V., 1993. Quantified phenotypic responses of mussels to eutrophication. In: Aldrich J. (ed.), Quantified phenotypic responses in morphology and physiology, Proceedings, 1992, Sept. 7–11, JAPAGA, Dublin, Ashford, 259–270. [Google Scholar]
- Shafei A., 1960. Lake Moeris and Lahun Mi-wer and Ro-hun: the great Nile control project executed by the ancient Egyptians. Bull. Soc. Géograph. Egypte, 33, 187–215. [Google Scholar]
- Smith EA., 1908. On the mollusca of Birket el Quarun, Egypt. Proc Malacol. Soc., 8, 9–11. [Google Scholar]
- Smol J.P., Wolfe A.P. and Birks H.J.B., 2005. Climate-driven regime shifts in the biological communities of arctic lakes. Proc. Natl. Acad. Sci., 102, 4397–4402. [Google Scholar]
- Sokal RR. and Rohlf FJ., 1995. Biometry: The principles and practice in biological research, Freeman, New York. [Google Scholar]
- Soliman GF., 1991. Observations on some physical conditions of Lake Qarun. In: El-Raey M. (ed.), Regional Symposium of Environmental Studies (UNARC) University of Alexandria, Alexandria, 588–601. [Google Scholar]
- Williams W.D., 1998. Salinity as a determinant of the structure of biological communities in salt lakes. Hydrobiologia, 381, 191–201. [CrossRef] [Google Scholar]
Cite this article as: N.V. Shadrin, G.M. EL-Shabrawy, E.V. Anufriieva, M.E. Goher, E. Ragab, 2016. Long-term changes of physicochemical parameters and benthos in Lake Qarun (Egypt): Can we make a correct forecast of ecosystem future?. Knowl. Manag. Aquat. Ecosyst., 417, 18.
All Tables
Physico-chemical parameters and their variability in Lake Qarun during 2008–2013 (Seasonal average/CVs)*.
Nutrient concentrations and their variability in Lake Qarun during 2008–2013 (Seasonal average/CVs).
Species composition and parts of the different species in total macrozoobenthos biomass g (wet weight) m-2 in Lake Qarun during 1974–2013.
Total average macrozoobenthos abundances and their variability in the Lake Qarun during 2006–2013 (ind.m-2).
Annual average individual wet weight (g) in populations of the different species in Lake Qarun during 1989–2013.
Long-term changes of total macrobenthos average biomass in Lake Qarun during 1974–2013 g (wet weight) m-2.
All Figures
|
Fig. 1 Scheme of sampling stations in Lake Qarun (Egypt). |
| In the text | |
|
Fig. 2 Diagram showing salinity changes in Lake Qarun between 1901 and 2013. |
| In the text | |
|
Fig. 3 Diagram showing changes of average NO2 concentration in Lake Qarun in 1954–2013 (x – number of years from 1954). |
| In the text | |
|
Fig. 4 Diagram showing benthos biomass changes in Lake Qarun in 1974–2013. |
| In the text | |
Current usage metrics show cumulative count of Article Views (full-text article views including HTML views, PDF and ePub downloads, according to the available data) and Abstracts Views on Vision4Press platform.
Data correspond to usage on the plateform after 2015. The current usage metrics is available 48-96 hours after online publication and is updated daily on week days.
Initial download of the metrics may take a while.