Fig 6
Download original image
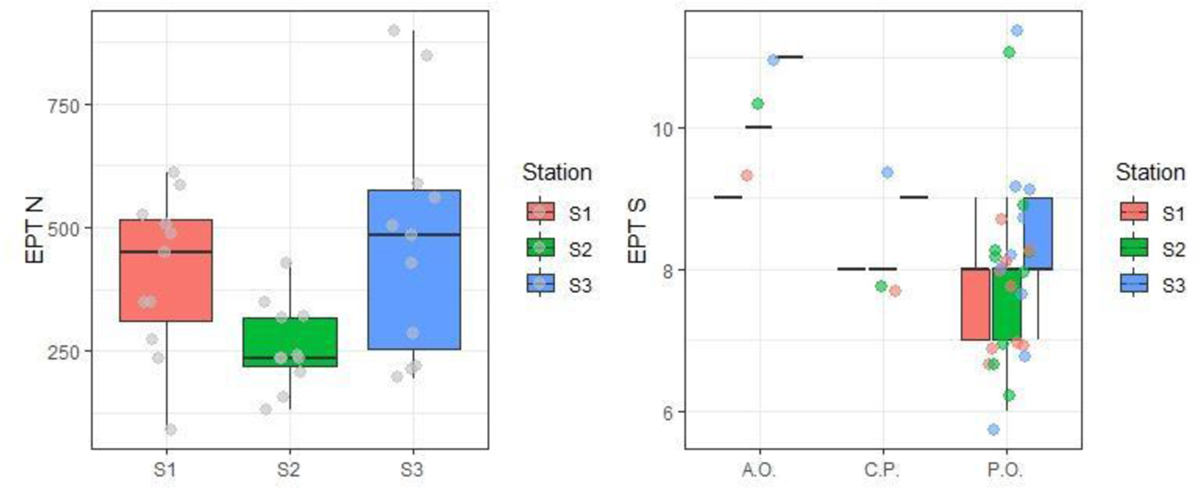
Box plots showing EPT abundance (N) and EPT richness (S) in the three monitoring stations and the three different phases: in salmon S1, in green S2 and in blue S3. Median values are represented by a horizontal bold line, the points represent 11 observations for each station and for each phase: A.O. = 3obs, C.P. = 3obs and P.O. = 9obs.
Current usage metrics show cumulative count of Article Views (full-text article views including HTML views, PDF and ePub downloads, according to the available data) and Abstracts Views on Vision4Press platform.
Data correspond to usage on the plateform after 2015. The current usage metrics is available 48-96 hours after online publication and is updated daily on week days.
Initial download of the metrics may take a while.