Open Access
Fig. 4
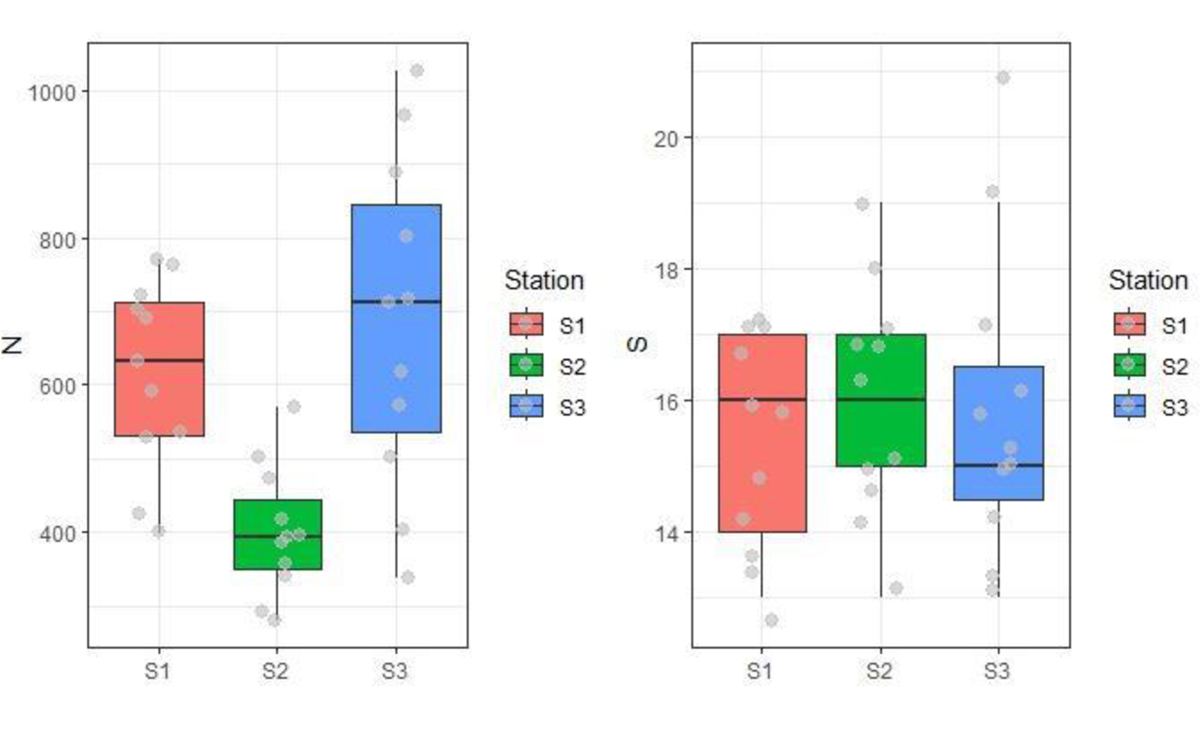
Download original image
Box plots showing macroinvertebrate abundance (N) and macroinvertebrate taxa richness (S) in the different monitoring stations: in salmon S1, in green S2 and in blue S3, 11 observations each, represented by the grey dots. Median values are represented by a horizontal bold line.
Current usage metrics show cumulative count of Article Views (full-text article views including HTML views, PDF and ePub downloads, according to the available data) and Abstracts Views on Vision4Press platform.
Data correspond to usage on the plateform after 2015. The current usage metrics is available 48-96 hours after online publication and is updated daily on week days.
Initial download of the metrics may take a while.