Fig. 3
Download original image
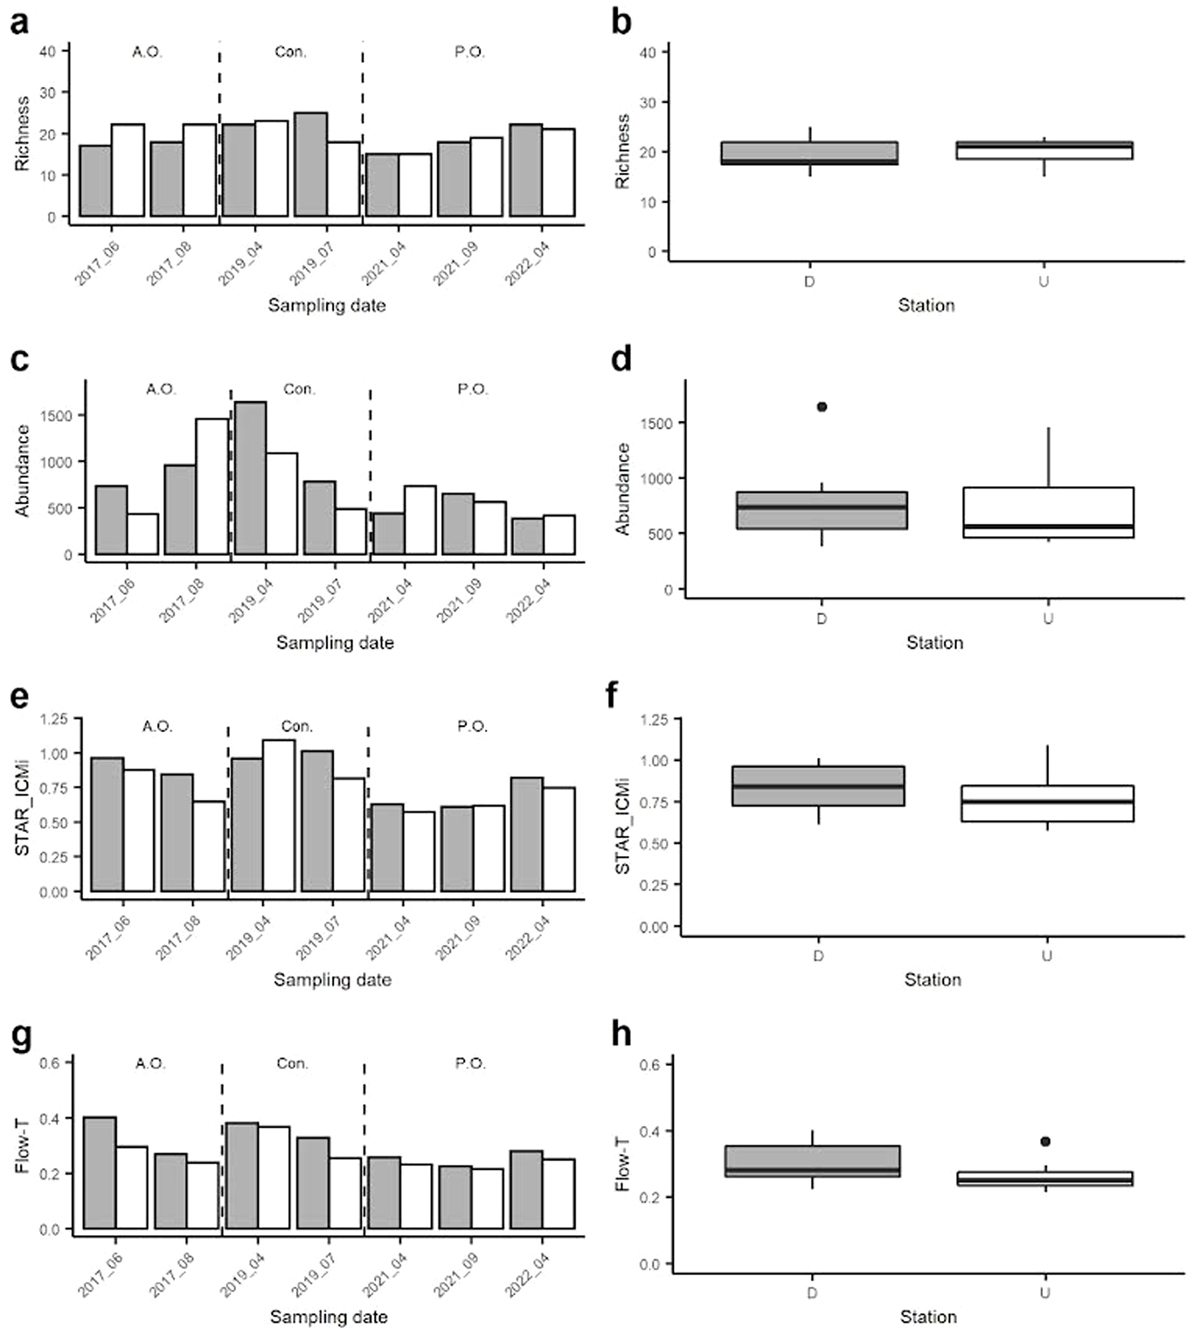
Bars and boxplots illustrate the variation in: (a, b) taxon richness, (c, d) total abundance, (e, f) STAR_ICMi index and (g, h) abundance-based Flow-T index over time and between the downstream (D; gray) and upstream (U; white) sampling stations. In boxplots: horizontal black line = median; lower and upper box edge = first and third quartiles, respectively; vertical lines indicate ±1.5 interquartile distance.
Current usage metrics show cumulative count of Article Views (full-text article views including HTML views, PDF and ePub downloads, according to the available data) and Abstracts Views on Vision4Press platform.
Data correspond to usage on the plateform after 2015. The current usage metrics is available 48-96 hours after online publication and is updated daily on week days.
Initial download of the metrics may take a while.