Fig. 2

Download original image
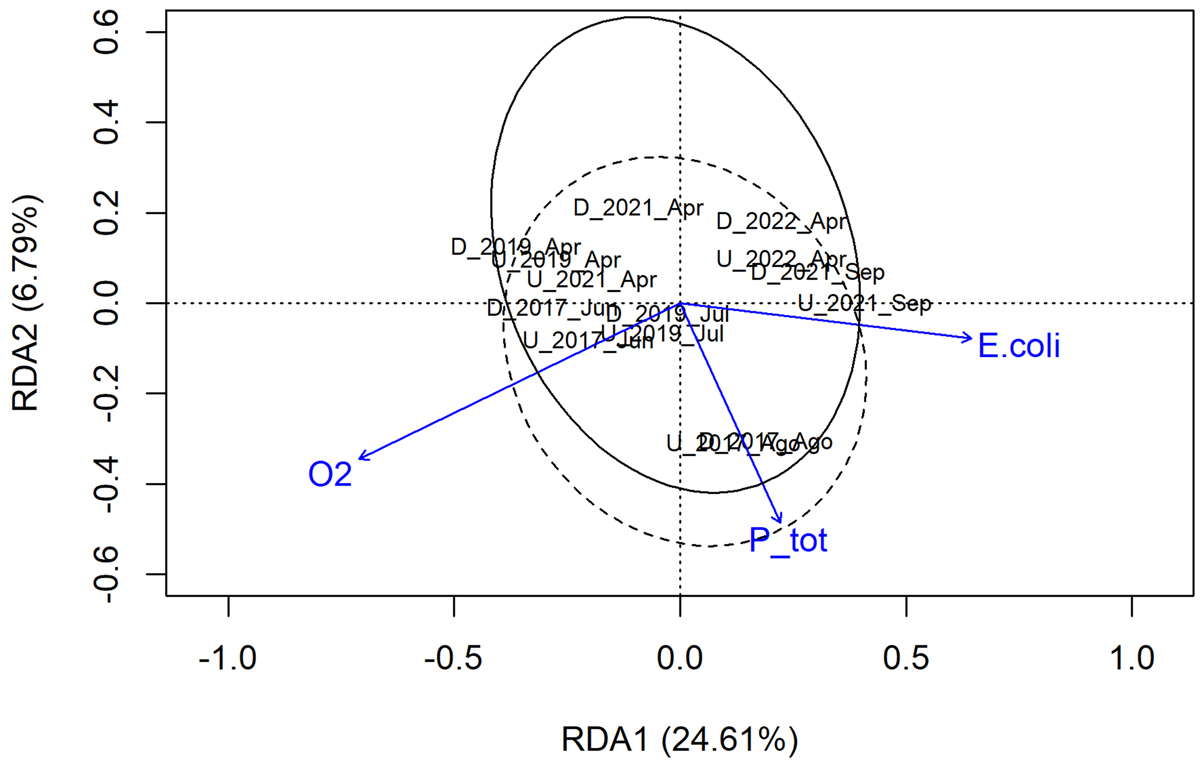
RDA ordination plot of macroinvertebrate community. Arrows indicate gradients in the three selected variables after stepwise forward selection (i.e. concentration of oxygen = O2, concentration of total phosphorous = P_tot, and amount of E. coli = E.coli). Labels indicate the macroinvertebrate community composition for each station (D = downstream; U = upstream) on each sampling occasion (year_month). Ellipses represent standard errors around the centroids for the downstream station (solid line) and upstream station (dashed line).
Current usage metrics show cumulative count of Article Views (full-text article views including HTML views, PDF and ePub downloads, according to the available data) and Abstracts Views on Vision4Press platform.
Data correspond to usage on the plateform after 2015. The current usage metrics is available 48-96 hours after online publication and is updated daily on week days.
Initial download of the metrics may take a while.


