Fig. 6

Download original image
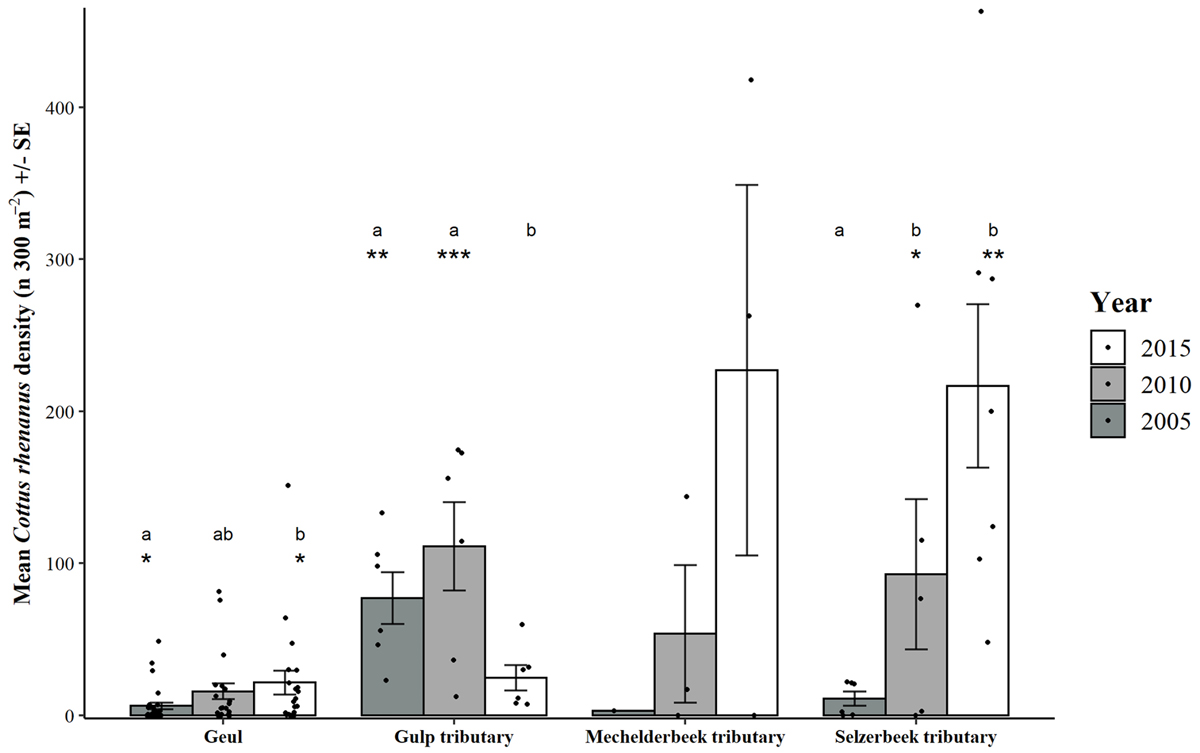
Mean density of Cottus rhenanus (number of individuals 300 m−2) in the River Geul catchment area per sampling year for each stream. Dots represent the density of each sampled transect. Error bars depict the standard error of the mean. Significant differences between sampling years tested with negative distributed regression models are indicated with letters. Sampling years of the Mechelderbeek could not be statistically compared due to too few sampled transects. *p < 0.05, **p < 0.01, ***p < 0.001.
Current usage metrics show cumulative count of Article Views (full-text article views including HTML views, PDF and ePub downloads, according to the available data) and Abstracts Views on Vision4Press platform.
Data correspond to usage on the plateform after 2015. The current usage metrics is available 48-96 hours after online publication and is updated daily on week days.
Initial download of the metrics may take a while.


