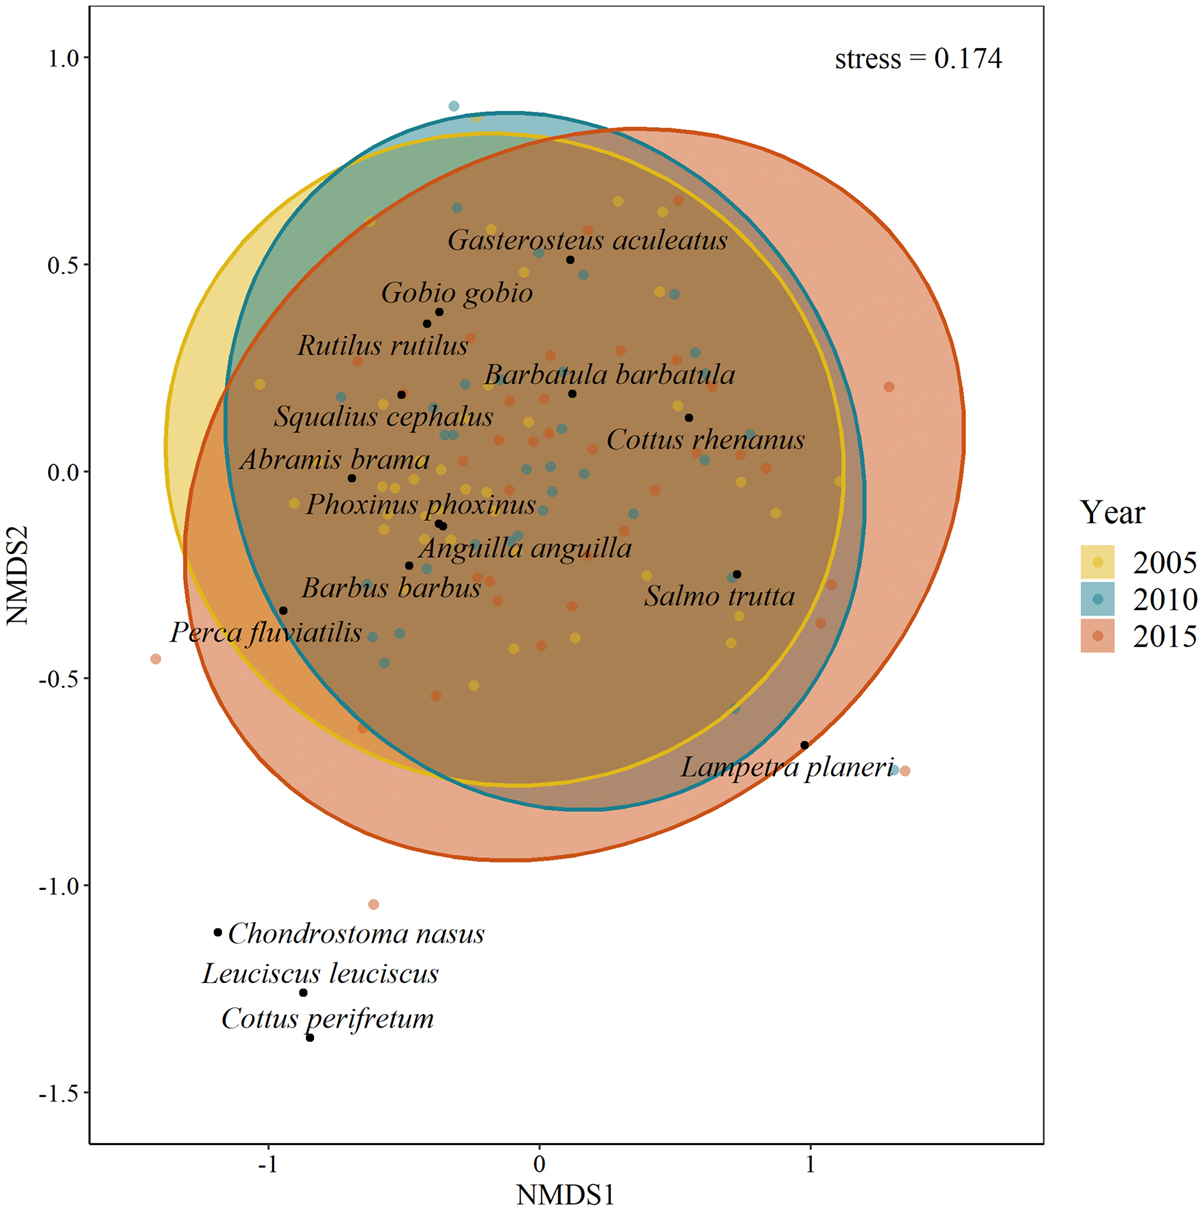
Fig. 4

Download original image
Non-metric multidimensional scaling (NMDS) plot based on Bray–Curtis distance between relative species abundance (rare species not included) by year. Coloured dots represent each sampled transect of a year, black dots represent fish species. Ellipses are drawn around the centroid (the mass of points in multivariate space) of the fish assemblage per sampling year, which represent the 95% confidence interval of the centroid.
Current usage metrics show cumulative count of Article Views (full-text article views including HTML views, PDF and ePub downloads, according to the available data) and Abstracts Views on Vision4Press platform.
Data correspond to usage on the plateform after 2015. The current usage metrics is available 48-96 hours after online publication and is updated daily on week days.
Initial download of the metrics may take a while.


