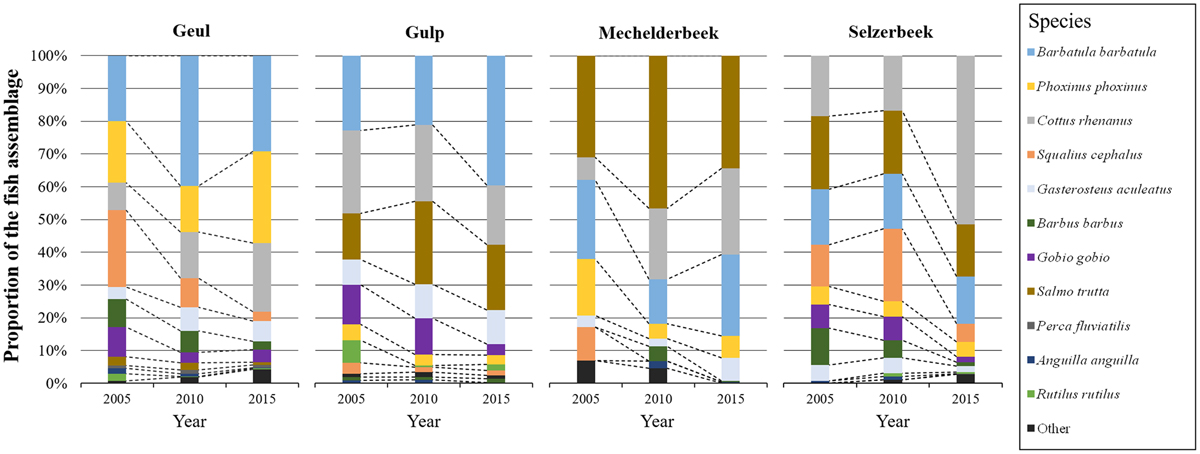
Fig. 3

Download original image
A representation of how species are proportionally part of the fish assemblage in each sampled stream and during each sampling year 2005–2010–2015, ordered by proportion. Species of which in total less than 200 individuals were caught, were accumulated as ‘Other’. Dashed lines demarcate proportions between species. The legend is ordered from top to bottom by highest to lowest cumulative proportion.
Current usage metrics show cumulative count of Article Views (full-text article views including HTML views, PDF and ePub downloads, according to the available data) and Abstracts Views on Vision4Press platform.
Data correspond to usage on the plateform after 2015. The current usage metrics is available 48-96 hours after online publication and is updated daily on week days.
Initial download of the metrics may take a while.


