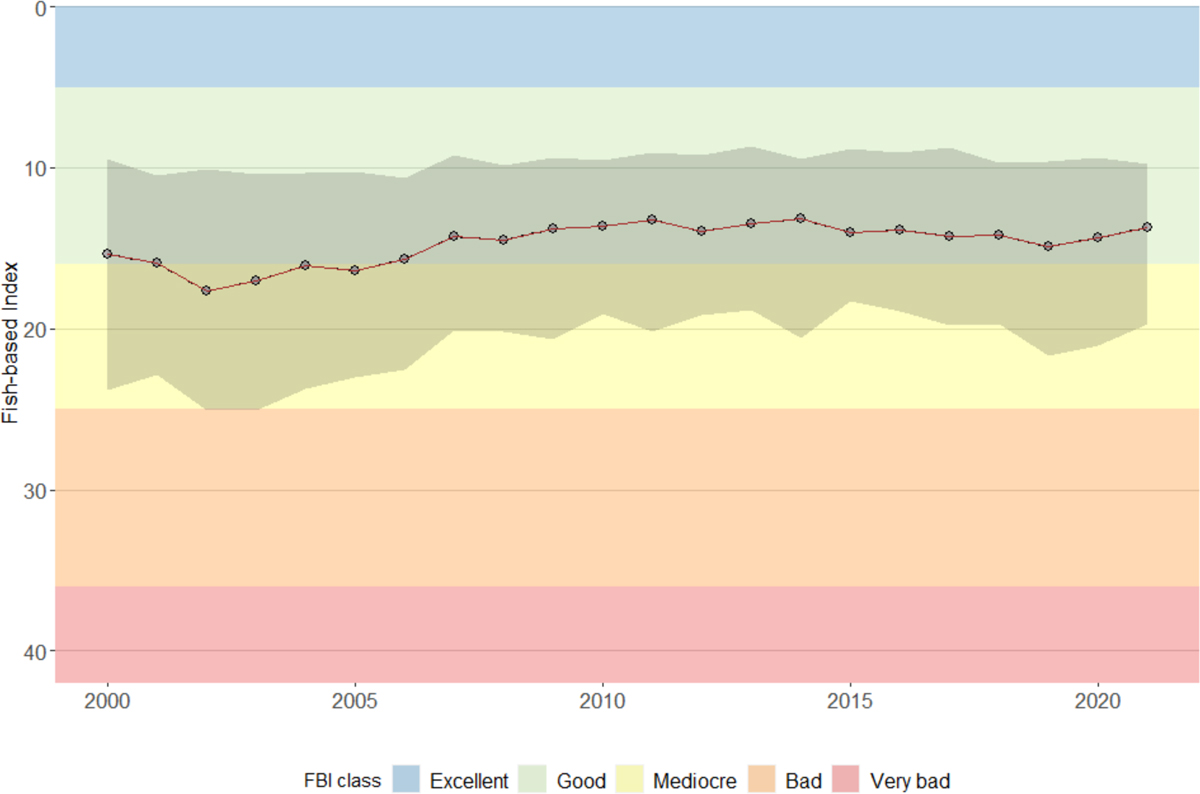
Fig. 5

Download original image
Temporal bioassessment trends. The background colours indicate the local ‘ecosystem health’ according to Oberdorff et al. (2002). The line and the dots indicate the annual median fish-based index (FBI) across lowland sites in mainland France (n=326 sites under 500m in altitude, sampled at least 10 years with a first survey before 2004 and a last survey after 2017). The shaded area indicates the interquartile range.
Current usage metrics show cumulative count of Article Views (full-text article views including HTML views, PDF and ePub downloads, according to the available data) and Abstracts Views on Vision4Press platform.
Data correspond to usage on the plateform after 2015. The current usage metrics is available 48-96 hours after online publication and is updated daily on week days.
Initial download of the metrics may take a while.


