Fig. 4
Download original image
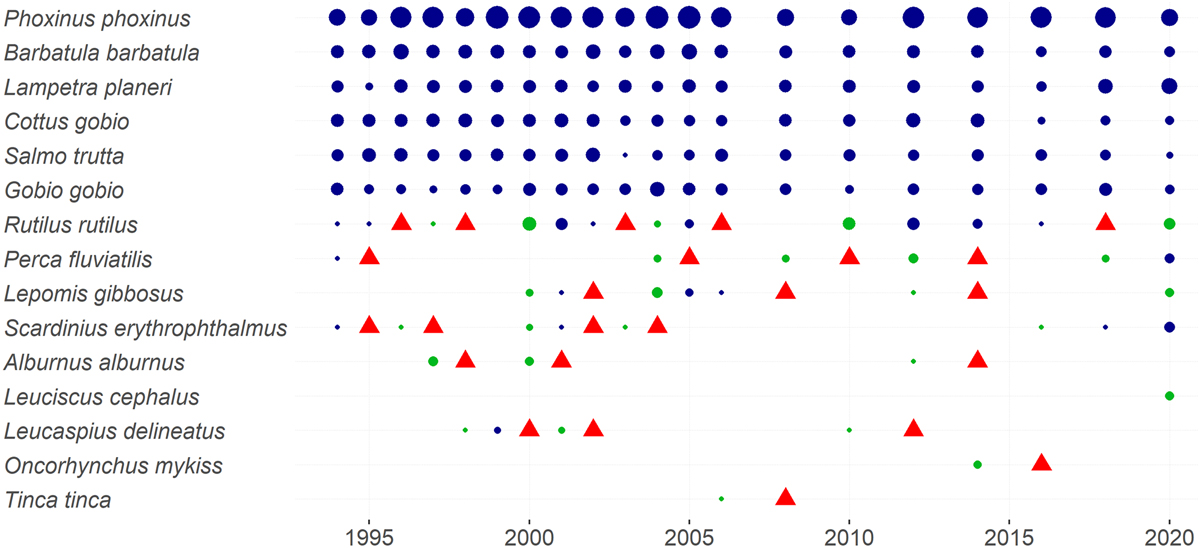
Example of temporal community dynamic (1994-2020) at the ‘Tardes’ sampling site (center France). The red triangles indicate local ‘extinctions’, i.e. the species is absent despite its presence at the previous survey. The green bubbles are local ‘colonisations’. The area of the green and blue bubbles is proportional to the number of individuals caught during each survey for each species. The species are ordered by their cumulated catch numbers over the period. Note that over 2006, the site was sampled only once every two years.
Current usage metrics show cumulative count of Article Views (full-text article views including HTML views, PDF and ePub downloads, according to the available data) and Abstracts Views on Vision4Press platform.
Data correspond to usage on the plateform after 2015. The current usage metrics is available 48-96 hours after online publication and is updated daily on week days.
Initial download of the metrics may take a while.