Fig. 2
Download original image
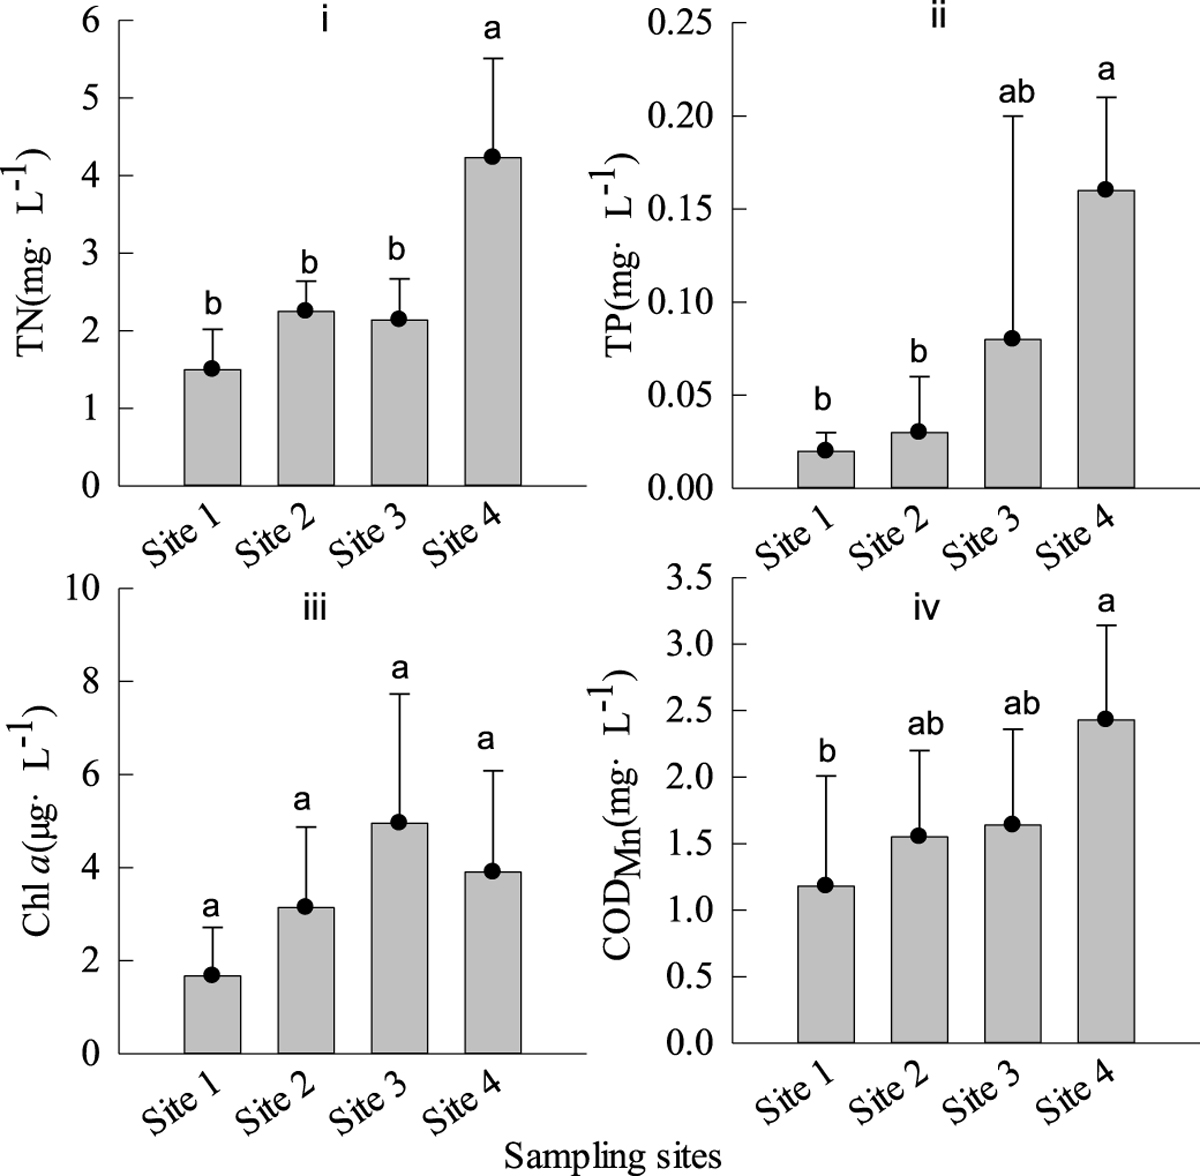
Chemical and biological characteristics of the headwater stream of the Qingjiang River (mean ± standard deviation). Vertical lines indicate standard deviation. Figure i, ii, iii and iv denote TN, TP, Chla and CODMn concentrations, respectively. Letters a and b indicate significant (p < 0.05) differences for physicochemical factors. Sampling sites that do not have a significantly different concentrations share a common letter.
Current usage metrics show cumulative count of Article Views (full-text article views including HTML views, PDF and ePub downloads, according to the available data) and Abstracts Views on Vision4Press platform.
Data correspond to usage on the plateform after 2015. The current usage metrics is available 48-96 hours after online publication and is updated daily on week days.
Initial download of the metrics may take a while.