Open Access
Fig. 12
Download original image
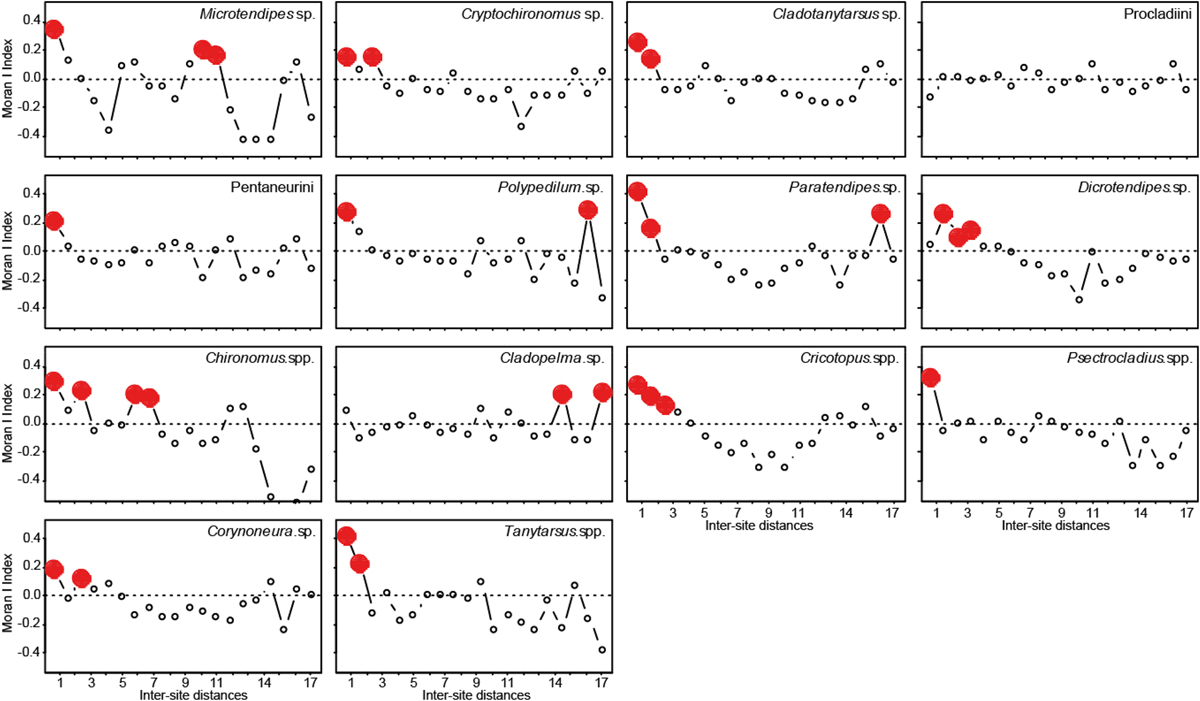
[({Appendix 5})] Spatial autocorrelation of the abundances estimated from Moran's I for the 14 most abundant taxa over 20 different distance classes. Circles in red represent significant autocorrelations.
Current usage metrics show cumulative count of Article Views (full-text article views including HTML views, PDF and ePub downloads, according to the available data) and Abstracts Views on Vision4Press platform.
Data correspond to usage on the plateform after 2015. The current usage metrics is available 48-96 hours after online publication and is updated daily on week days.
Initial download of the metrics may take a while.