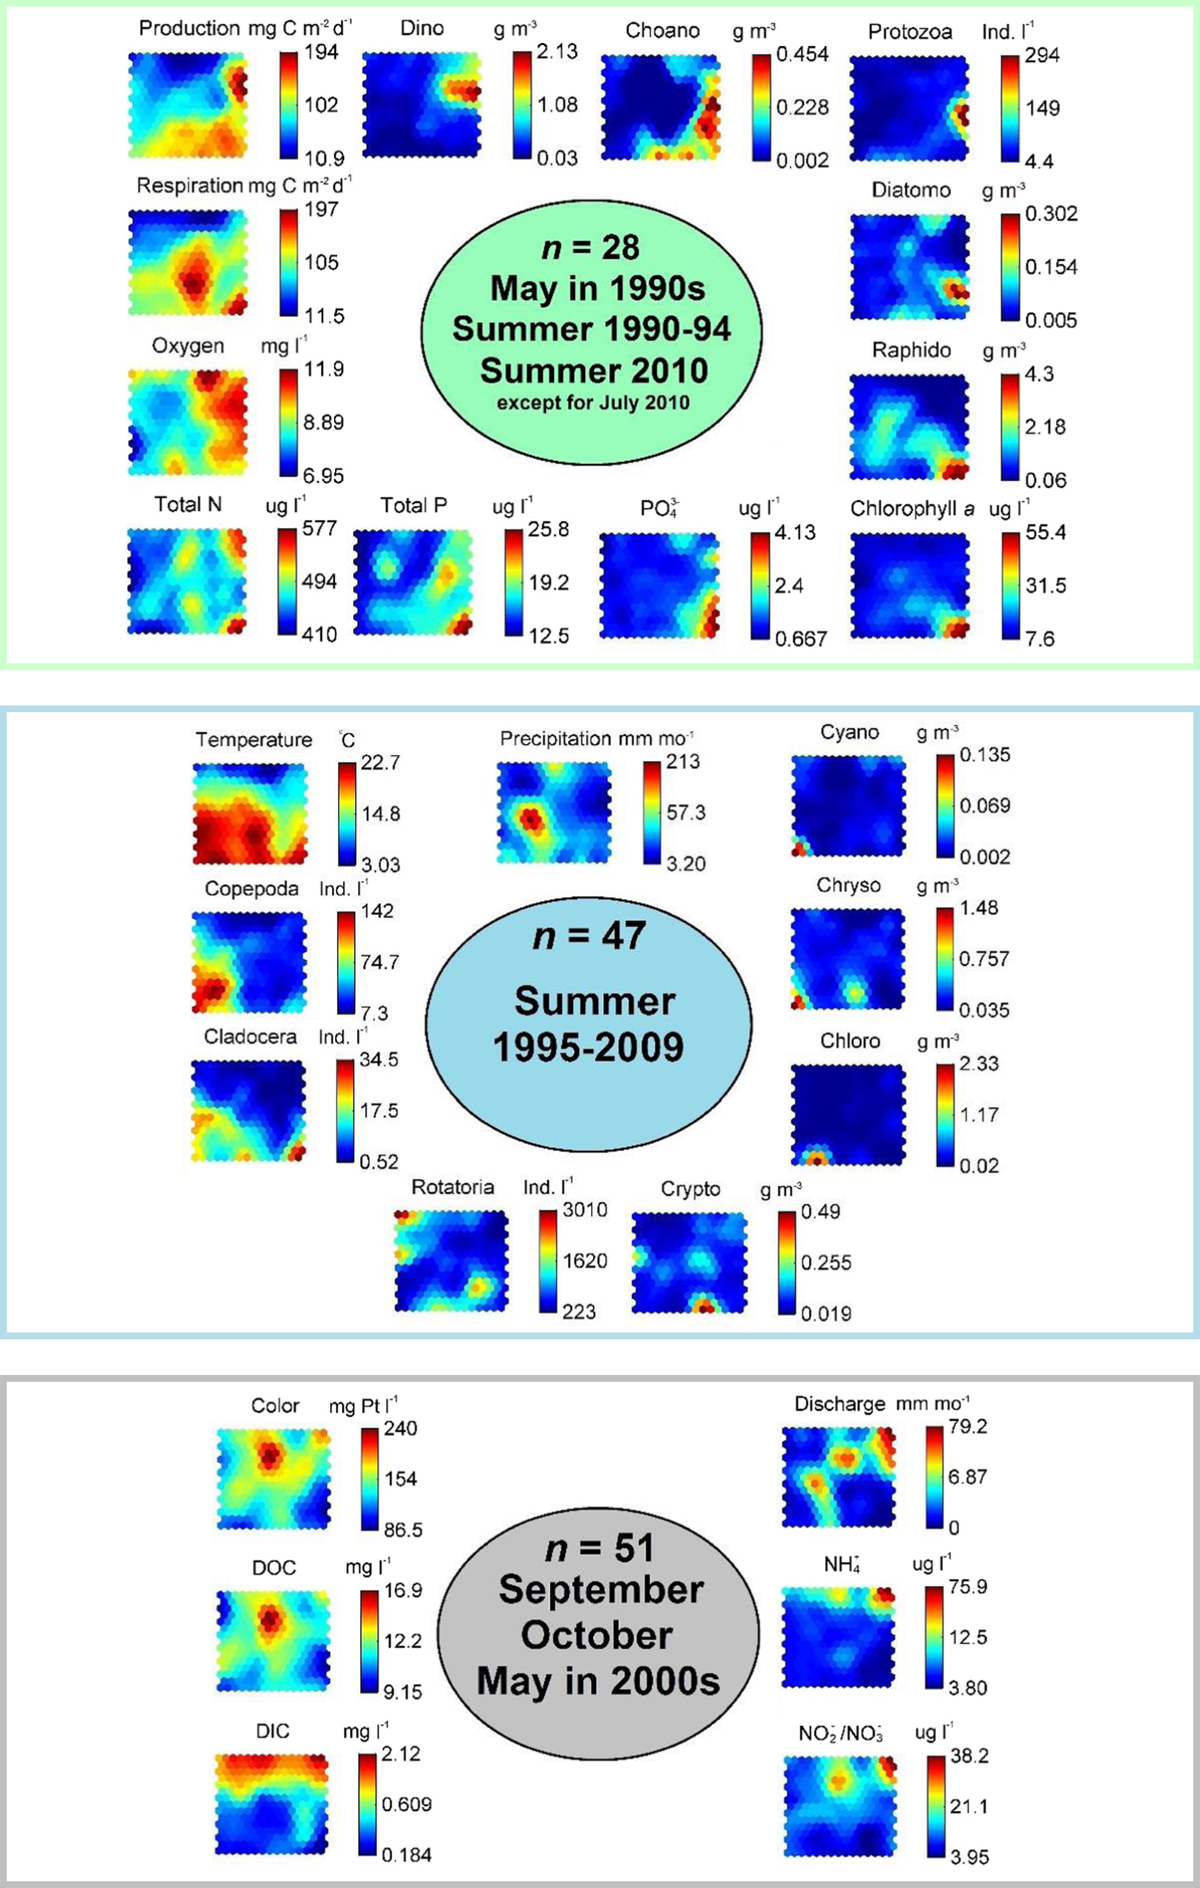
Fig. 3
Download original image
Associations between the groups from the first step SOM and clusters from the second step SOM. The first SOM divided the data into three groups according to months and years of sampling. The second SOM divided the data into three clusters according to 27 variables monitored. In the figure, the groups are indicated with different colours (green, blue, and grey) and the variables are situated close to the group to which they associated with. n refers to the number of sampling dates per group.
Current usage metrics show cumulative count of Article Views (full-text article views including HTML views, PDF and ePub downloads, according to the available data) and Abstracts Views on Vision4Press platform.
Data correspond to usage on the plateform after 2015. The current usage metrics is available 48-96 hours after online publication and is updated daily on week days.
Initial download of the metrics may take a while.