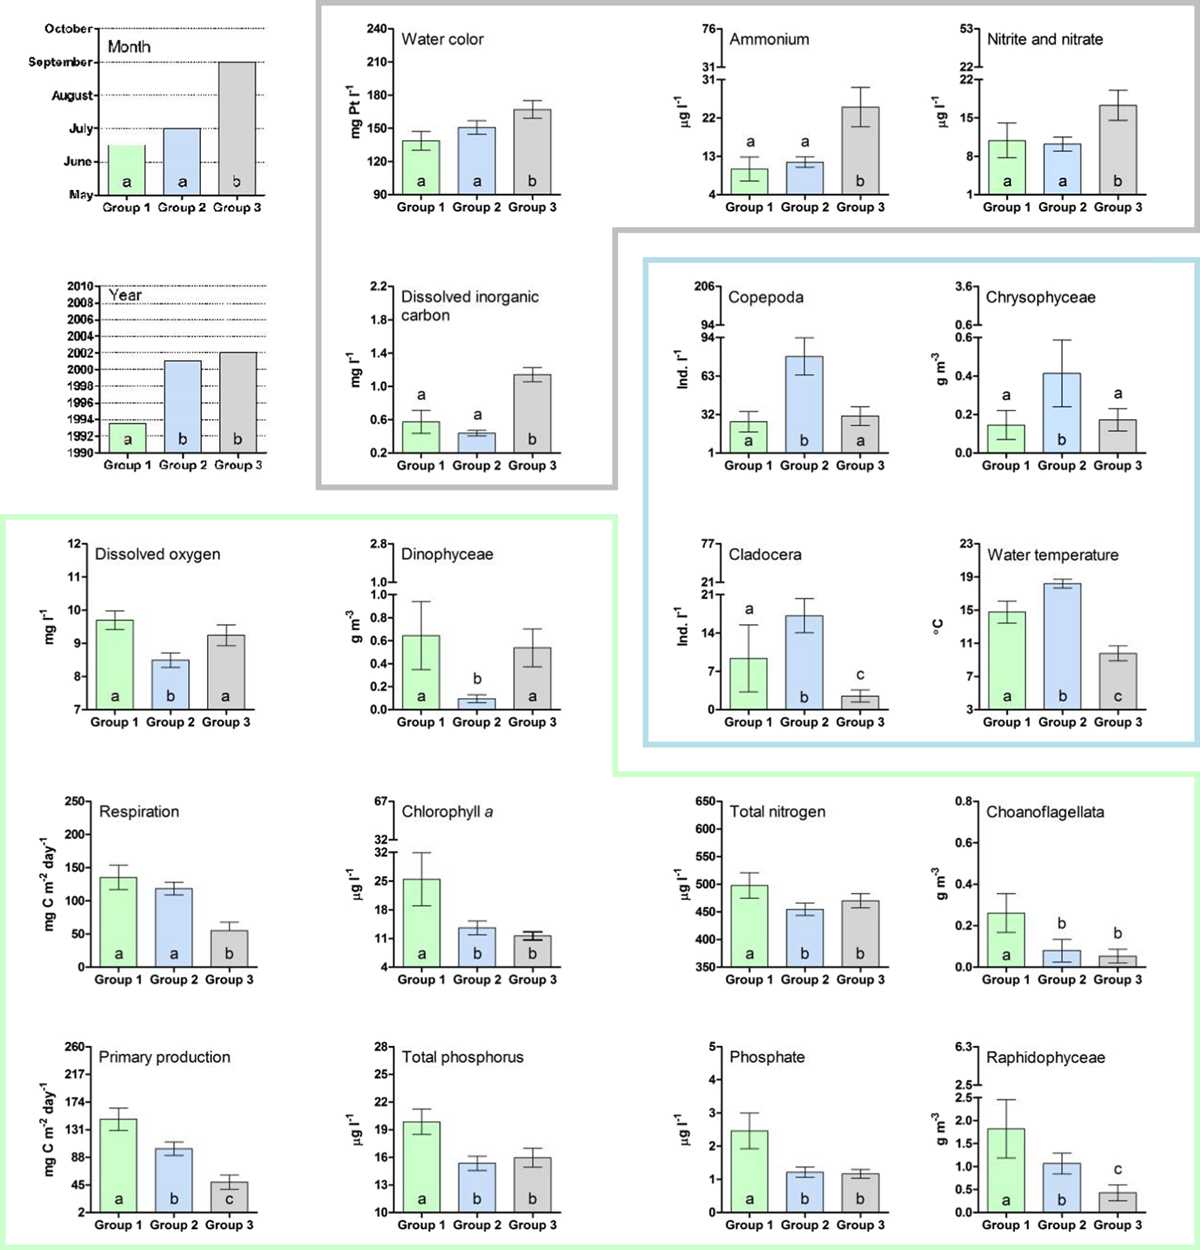
Fig. 2
Download original image
Variables which differed across the three groups formed by the SOM. Statistically significant (p < 0.05) difference between the groups is indicated with different letters a, b, and c. The groups which did not differ from each other are marked with the same letter. Variables are arranged and separated with lines from each other so that they correspond to the SOM groups which in turn are indicated with different colours (green, blue, and grey). In the SOM component planes (small figures representing the variables monitored), colours refer to the adjacent scale bar.
Current usage metrics show cumulative count of Article Views (full-text article views including HTML views, PDF and ePub downloads, according to the available data) and Abstracts Views on Vision4Press platform.
Data correspond to usage on the plateform after 2015. The current usage metrics is available 48-96 hours after online publication and is updated daily on week days.
Initial download of the metrics may take a while.