Fig. 2

Download original image
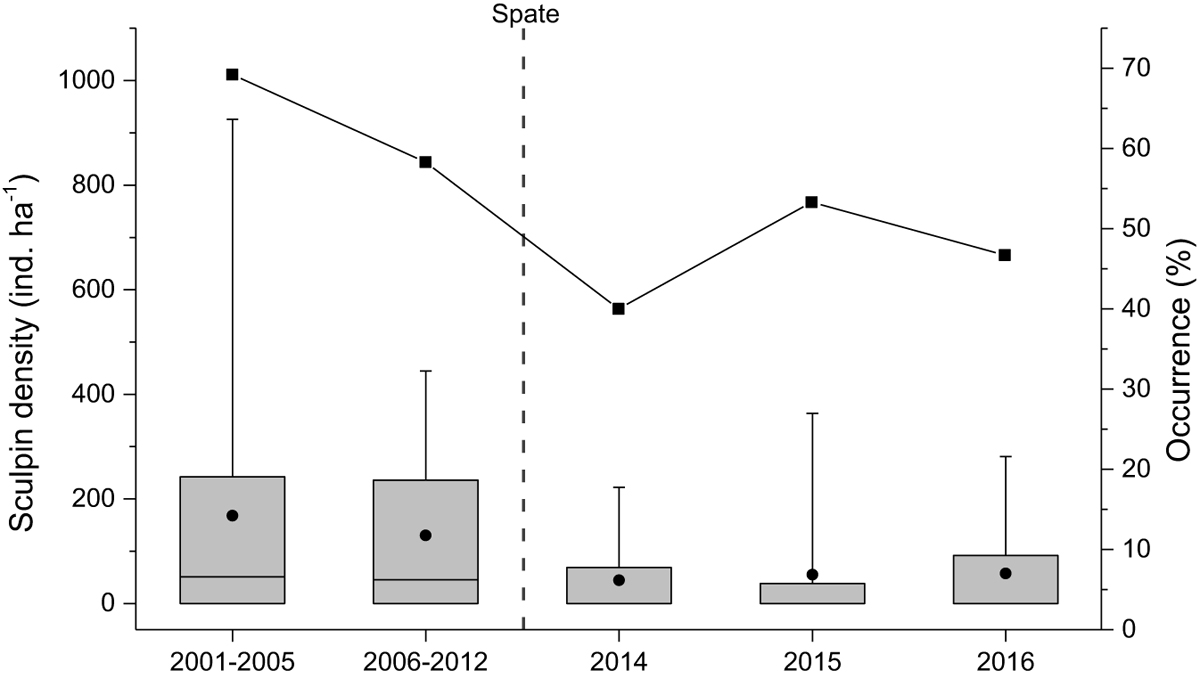
Mean density (box-plots) and percentage of occurrence (■) of Pyrenean sculpin Cottus hispaniolensis in the sampling sites from 2001 to 2016. Due to unequal sampling effort among years, data is pooled in several time groups. In box-plot, filled circle is the mean and solid horizontal line is the median. Upper and lower box limits are the 25th and 75th percentiles, and bars represent the 5th and 95th percentiles. The spate of June 2013 is represented as a dashed vertical line.
Current usage metrics show cumulative count of Article Views (full-text article views including HTML views, PDF and ePub downloads, according to the available data) and Abstracts Views on Vision4Press platform.
Data correspond to usage on the plateform after 2015. The current usage metrics is available 48-96 hours after online publication and is updated daily on week days.
Initial download of the metrics may take a while.


